

Analysis
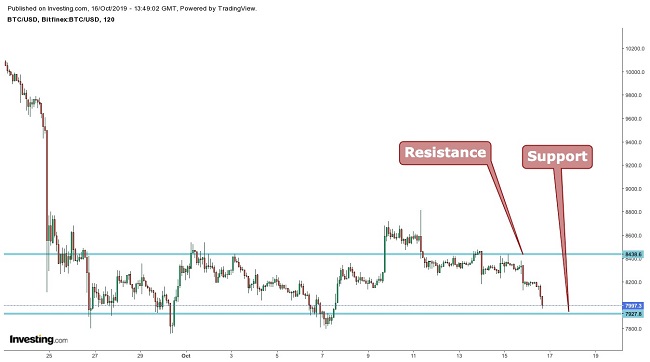
When looking at the chart below we see that Bitcoin(BTC)trade is currently trading at $8,014. It is also seen that the price is still trading between the channels, with the upper limit at $8,436 acting as resistance and the lower limit is at $7,927 acting as support.
Currently the cryptocurrency’s price is around its support level. Therefore, long positions can be taken around the support level for swing trading, keeping the stop-loss near the support, as the price is expected to trade between the channels for some time.
Dow Theory
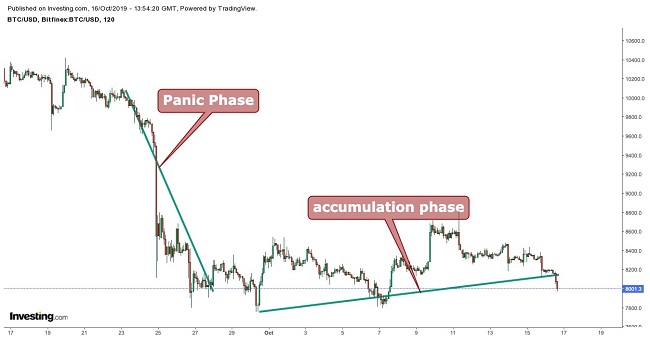
According to Dow Theory, the BTC price is in the accumulation phase. It is a period when investors are actively buying against the general opinion of the market. During this phase, the price does not change much because these investors are in the minority, demanding quantity that the market at large is supplying. It is followed by the participation phase.
Bollinger Bands
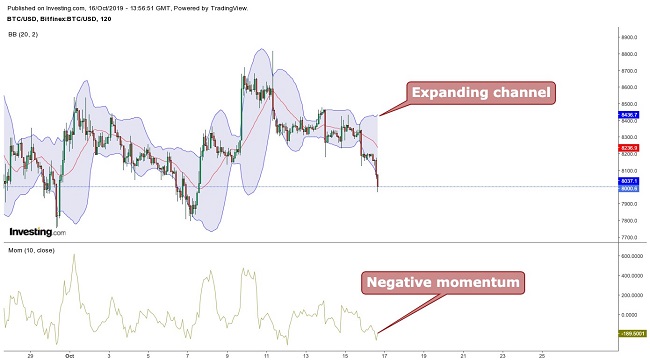
The Bitcoin price is moving between the channels with the lower channel limit acting as support and the middle average line acting as resistance. It is seen that the channel is expanding with a negative momentum.

This indicates increased volatility with a negative sentiment, so the price may fall further. For taking a long position around the support level for swing trading it is suggested to stick to the stop-loss.
Moving Average
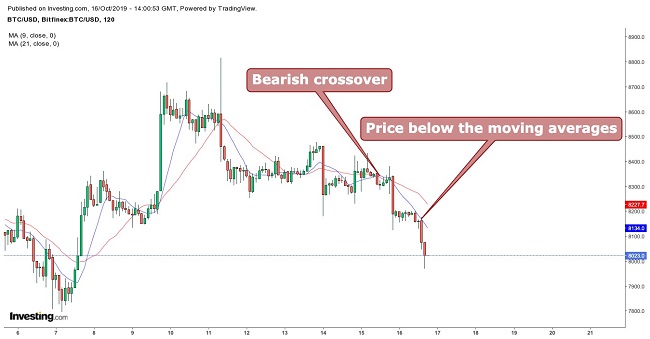
When taking 9 period moving averages (blue) with 21 period moving averages (red), a bearish crossover is seen with the price trading below the 9 and 21 period moving average. It is suggested to wait until the BTC price closes above the moving averages before taking a long position.
Conclusion
When looking at the chart we can see that Bitcoin is currently trading at $8,014. The resistance is around $8,436 and support is around $7,927. The price is expected to trade between the channels for some time so swing trading can be done using the above mentioned levels.
The current overall trend is sideways with some negative sentiment, which can drag the price lower. A day close below $7,900 can drag the price lower to $7,700. On the upward side, the largest cryptocurrency faces minor resistance at $8,100, and long positions should only be taken above this level. A day close above $8,400 can take the price all the way up to $8,700.
Pivot Points
| Name | S3 | S2 | S1 | Pivot Points |
R1 | R2 | R3 |
| Classic | 6783.4 | 7289.2 | 7803.8 | 8309.5 | 8824.1 | 9329.8 | 9844.4 |
| Fibonacci | 7289.2 | 7678.9 | 7919.7 | 8309.5 | 8699.3 | 8940.1 | 9329.8 |
| Camarilla | 8037.7 | 8131.2 | 8224.8 | 8309.5 | 8411.8 | 8505.4 | 8598.9 |
| Woodie’s | 6787.8 | 7291.4 | 7808.2 | 8311.7 | 8828.5 | 9332.0 | 9848.8 |
Technical Indicators
| Name | Value | Action |
| RSI(14) | 45.296 | Neutral |
| STOCH(9,6) | 24.943 | Sell |
| STOCHRSI(14) | 0.000 | Oversold |
| MACD(12,26) | 456.800 | Buy |
| ADX(14) | 31.696 | Sell |
| Williams %R |
-94.363 | Oversold |
| CCI(14) | -166.9263 | Sell |
| ATR(14) | 1380.9217 | Less Volatility |
| Highs/Lows(14) | -1075.2829 | Sell |
| Ultimate Oscillator |
44.845 | Sell |
| ROC | -29.193 | Sell |
| Bull/Bear Power(13) |
-1836.2574 | Sell |

 Offering Risks Retirement Security of Americans, Says Labor Department Official – Finance Bitcoin News")

