
Analysis
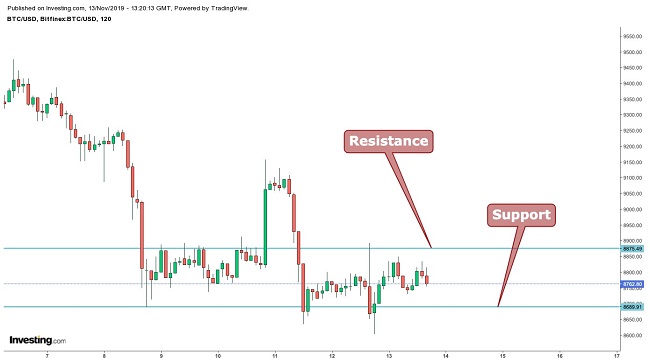
When looking at the chart below, we can see that Bitcoin(BTC)trade is currently trading at $8,792. It can also be observed that the largest cryptocurrency’s price is back into the channel with an upper limit at $8,875 acting as resistance and the lower limit at $8,689 acting as support.
Additionally, there is a formation of shooting star pattern which indicates that the price might touch the lower limit.
Dow Theory
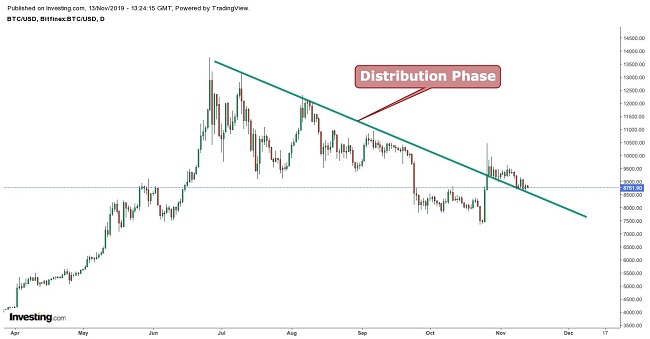
Bitcoin is currently appearing in the distribution phase of Dow Theory. During this phase, informed investors exit their long positions, and at this stage, the market tends to be overbought although uninformed traders still believe that more bullishness is on its way.
Bollinger Bands
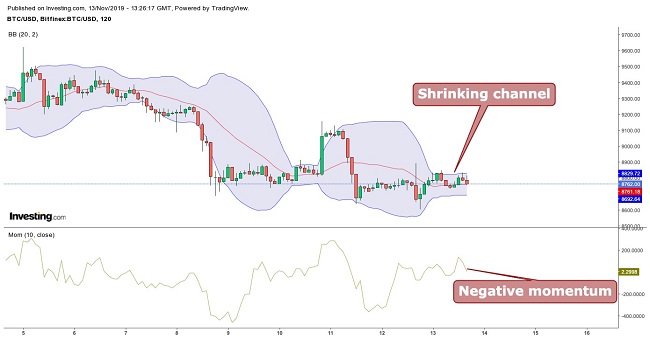
The Bitcoin price is moving between the channels with the lower limit acting as support and the upper limit acting as resistance. It can be seen that the channel is shrinking with negative momentum, which indicates the price’s decreased volatility and a negative momentum.

Therefore the price is expected to trade inside the channel for some time without any major upward or downward movement.
Moving Average
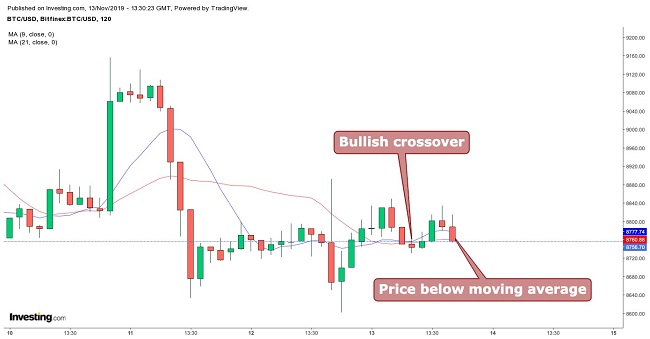
When taking 9 period moving averages (blue) with 21 period moving averages (red), a bullish crossover is seen; yet, the BTC price is trading below the 9 and 21 period moving average. This indicates an indecision and therefore it is suggested not to take long positions until the price starts trading above the moving average.
Conclusion
Bitcoin(BTC)trade is currently trading at $8,792. The resistance is at $8,875 and support is at $8,689. It is suggested not to take long positions at this current price, and wait for the cryptocurrency’s price to touch the support; long positions can be taken as long as the price stays above the support.
Swing trading could be done. Long term position should not be taken as there is an indecision in the crypto market. The above mentioned levels can be used for swing trading. A day’s closing below $8,600 can drag the BTC price to the $8,300 levels. A day’s closing above $8,900 can take the price to the $9,250 levels.
Pivot Points
| Name | S3 | S2 | S1 | Pivot Points | R1 | R2 | R3 |
| Classic | 7536.5 | 8112.3 | 8470.2 | 9046.0 | 9403.9 | 9979.7 | 10337.6 |
| Fibonacci | 8112.3 | 8469.0 | 8689.3 | 9046.0 | 9402.7 | 9623.0 | 9979.7 |
| Camarilla | 8571.3 | 8656.9 | 8742.5 | 9046.0 | 8913.6 | 8999.2 | 9084.8 |
| Woodie’s | 7427.5 | 8057.8 | 8361.2 | 8991.5 | 9294.9 | 9925.2 | 10228.6 |
Technical Indicators
| Name | Value | Action |
| RSI(14) | 49.702 | Neutral |
| STOCH(9,6) | 40.157 | Sell |
| STOCHRSI(14) | 29.209 | Sell |
| MACD(12,26) | 460.400 | Buy |
| ADX(14) | 27.151 | Sell |
| Williams %R | -66.664 | Sell |
| CCI(14) | -60.4962 | Sell |
| ATR(14) | 1265.4644 | Less Volatility |
| Highs/Lows(14) | -1.5406 | Sell |
| Ultimate Oscillator | 44.762 | Sell |
| ROC | -22.626 | Sell |
| Bull/Bear Power(13) | -533.9520 | Sell |
What do you think about the article?