

Bitcoin Price Sitting Still at $10K – What Could Make It Move?
September 23, 2019 by Ramiro Burgos
The bitcoin price has hovered around the $10,000 USD level for so long we’re running out of headlines. No amount of news, spin or events seems able to budge it from that position. What do the charts say? Read our weekly technical analysis to find out.
Also read: Is the Bitcoin Price Leaving the Bears Behind?
Subscribe to the Bitsonline YouTube channel for great videos featuring industry insiders & experts
Bitcoin Price Technical Analysis
Long-Term Analysis
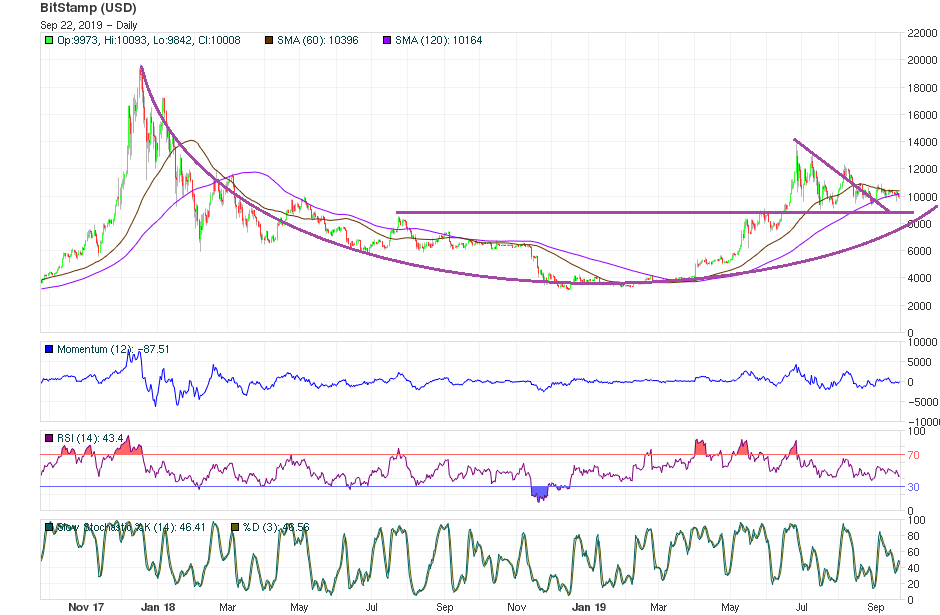
After going sideways over the past four months in a lateral market around $10,000, the bitcoin price gained strength and a Bullish Consensus walked away from a bearish channel influence — and is heading to a rounded bottom long-term formation rising zone.
If the trend sustains current levels for another two weeks to arrive at the aforementioned formation crossing mark, the dispersed general will may join back in to push things higher. A 3,000 basis point scenario, which recognizes $9,000 as a support and a resistance near $12,000, seems to be where the action is. Meanwhile, the Mass Psychology Analysis Hope phase reminds active.
Mid-Term Analysis
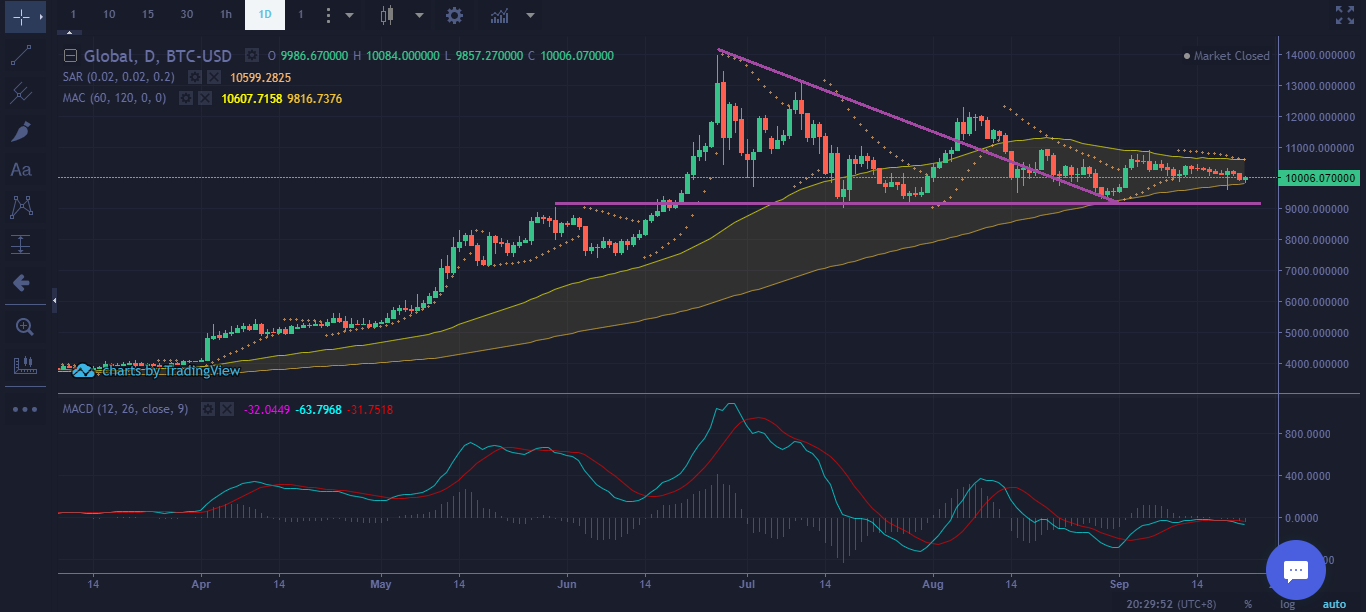
Mathematical Indicators turned down again to bring negative signals, but nothing is affecting the lateral trend developing structure around $10,000. This seems to be strong and balanced among contradictory News and external factors.
The target to the up side for a long term Rounded Bottom formation would take place near $15,000, considering an average between its long term starting peak near $19,000. This is the next reacting point prices could reach if and when they stay on the same $10,000 axis for another two weeks.
Short-Term Analysis
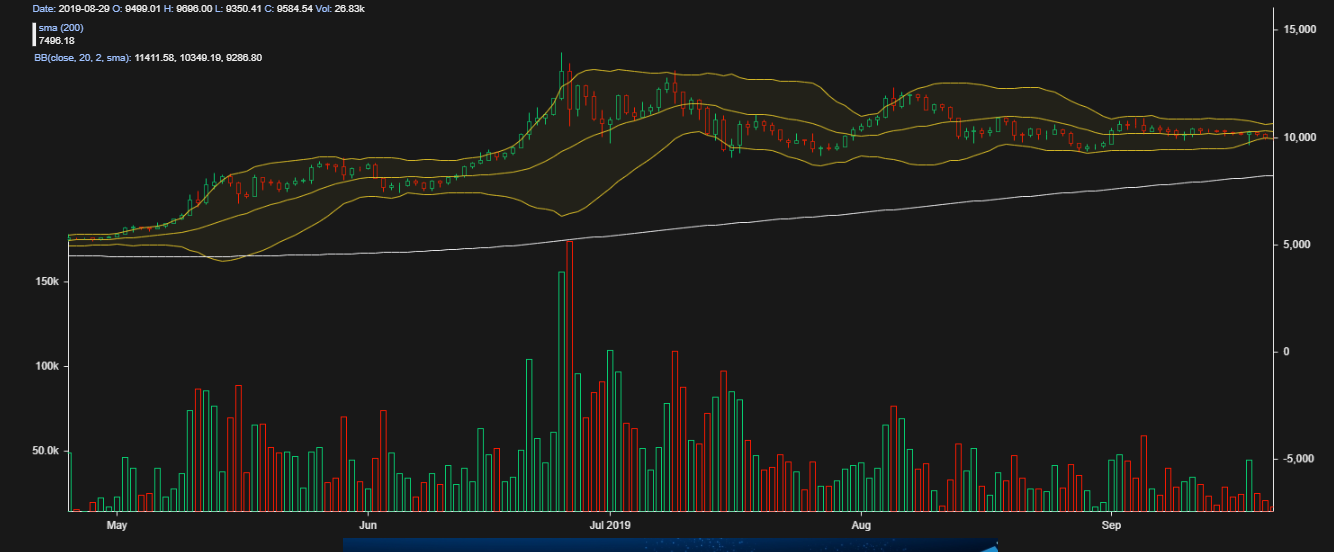
Bollinger Bands Analysis has turned negative since prices crossed down the center line, but Japanese Candlestick Fairy images point to a tense balance between Soldiers and Crows, confirming an activity range between $9,000 and $12,000.
Volatility is high and it could sustain current price levels, swinging the quotes up and down around the same $10,000 axis. This could maintain stability around the reference, which confirms current levels as a new ground to build a soft bullish trend backed by News and gradual political acceptance.
What do you think will happen to the bitcoin price? Share your predictions in the comments below.
If you find Ramiro’s analyses interesting or helpful, you can find out more about how he comes to his conclusions by checking out his primer book, the Manual de Análisis Técnico Aplicado a los Mercados Bursátiles. The text covers the whole range of technical analysis concepts, from introductory to advanced and everything in between. To order, send an email to [email protected]

Images via Pixabay, Ramiro Burgos
This technical analysis is meant for informational purposes only. Bitsonline is not responsible for any gains or losses incurred while trading bitcoin.

 Ecosystem Grew Massively In Q4 2022, What To Expect Next?")
