

Bitcoin Price: It’s $7K for Now, but Hope Is on the Horizon
December 16, 2019 by Ramiro Burgos
We can’t promise you another Christmas like 2017. The bitcoin price could stays at its current $7,000 USD level until another bullish consensus shows itself. But there’s hope: literally, a Hope phase may be active again. Read our weekly technical analysis for more information.
Also read: $10K Bitcoin Price Again? Let’s Look at the Charts
Bitcoin Price Technical Analysis
Long-Term Analysis
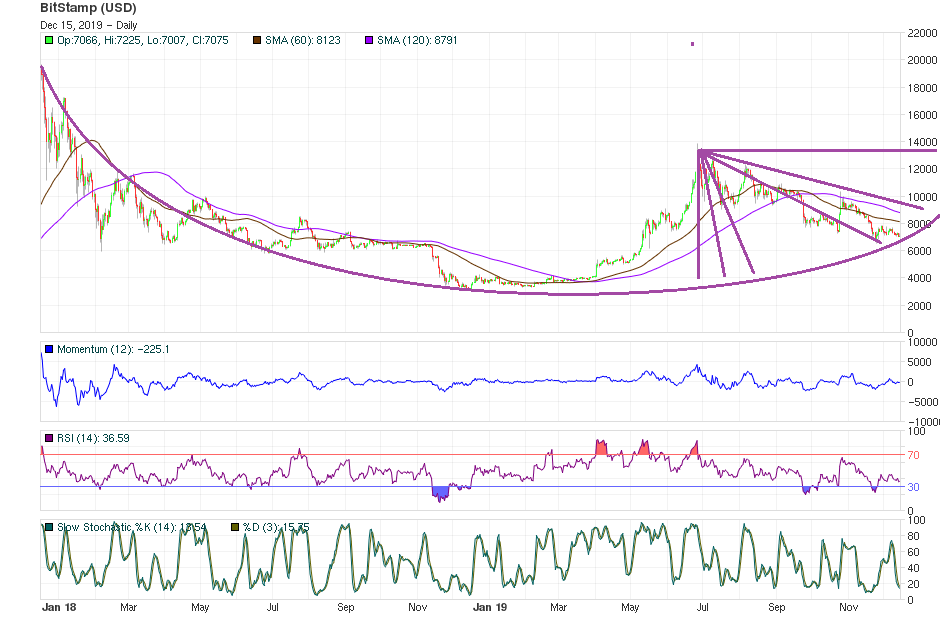
Prices have recognized the ascending curve of a Rounded Bottom Formation at $7,000. According to Mass Psychological Analysis, a Hope phase is active again, and depends on News for a reversal reaction which could give way to optimism.
Our next resistance point could be considered at $9,000 which could would act as a psychological trigger for an upward rally. However if quotes keep going lateral and walk away from the curve, they could lose strength and fall to their next support — calculated at around $6,000.
Mid-Term Analysis
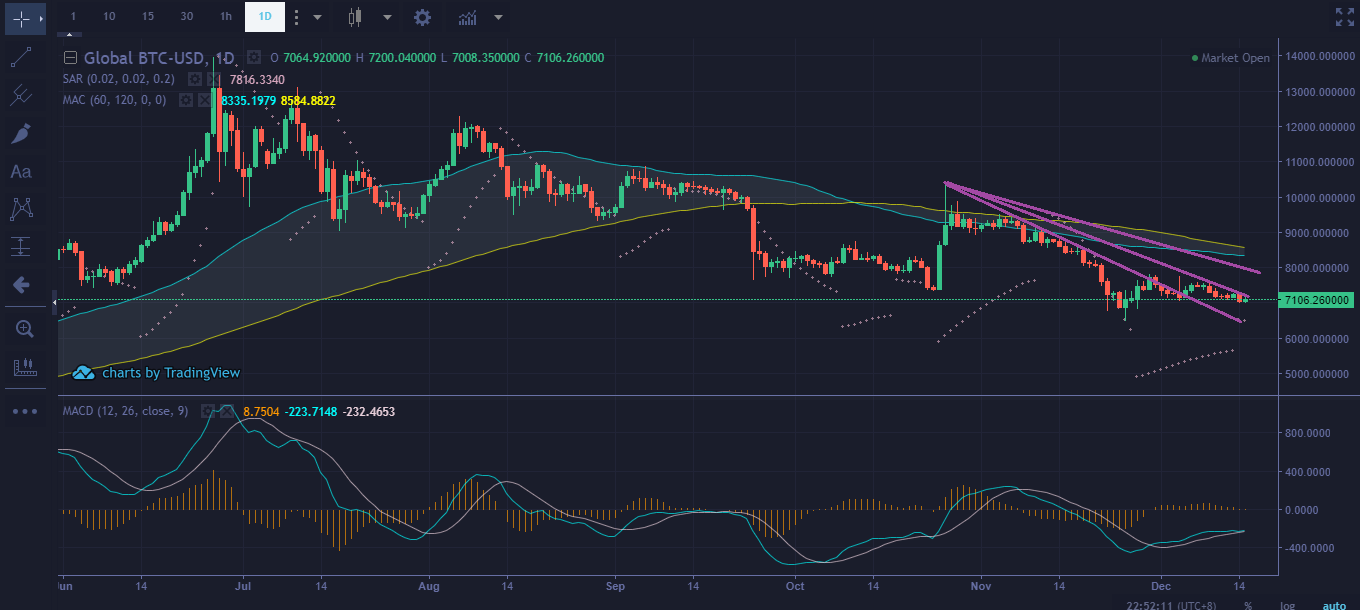
Fibonacci Fan Lines favor a bullish reaction which could drive the trend beyond $9,000, sparking a technical chain reaction to higher levels if it confirms. Increasing volatility and mathematical indicators reflect a bullish scenario that depends on external factors to gear the elements for a rise.
The current sideways movement can be compared to the same situation that occurred in October, when values synchronized with technical instruments via a partial uptrend movement.
Short-Term Analysis
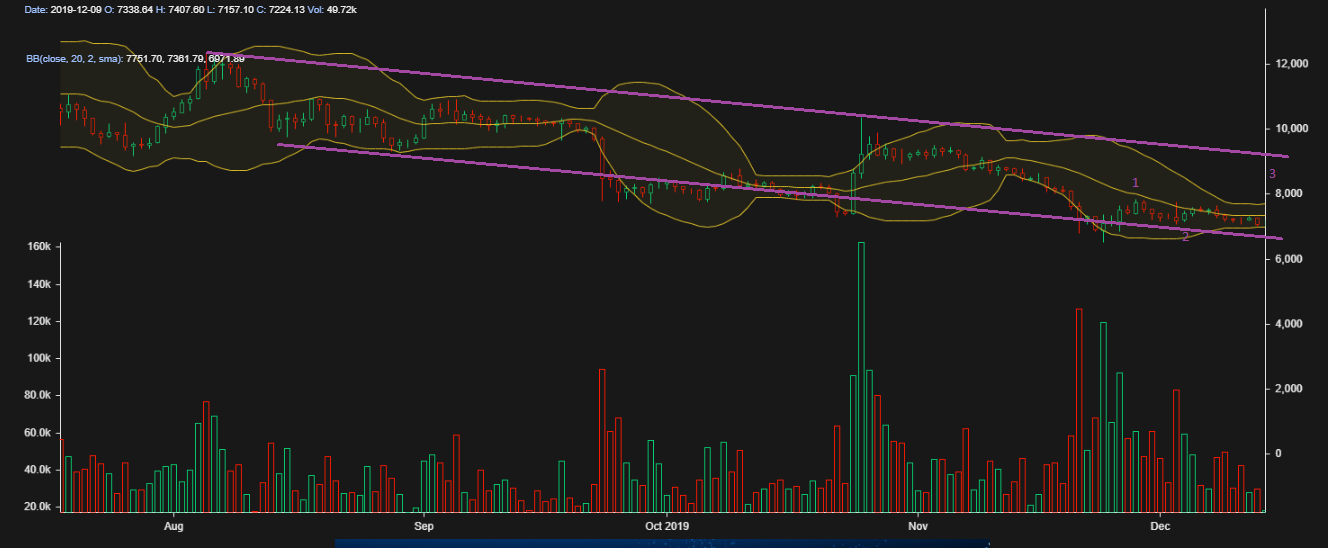
Even though prices have been going lateral since September 2019, a smooth bearish channel is reflected in the chart, recognizing the next support level near $6,000.
Japanese Candlesticks’ imaginary battlefield is controlled by Offer´s Crows, which could settle between $8,000 and $1,200. Combining this criterion with Bollinger Bands Analysis, we see Demand Soldiers are taking too long to enter the battle. To leave the bearish trend, the bitcoin price needs to move higher to somewhere near $8,500, where Elliott’s theoretical 3rd wave (in progress) ends.
What do you think will happen to the bitcoin price? Share your predictions in the comments below.
If you find Ramiro’s analyses interesting or helpful, you can find out more about how he comes to his conclusions by checking out his primer book, the Manual de Análisis Técnico Aplicado a los Mercados Bursátiles. The text covers the whole range of technical analysis concepts, from introductory to advanced and everything in between. To order, send an email to [email protected]
Images via Pixabay, Ramiro Burgos
This technical analysis is meant for informational purposes only. Bitsonline is not responsible for any gains or losses incurred while trading bitcoin.

