

Bitcoin gained bullish momentum and rallied above the $11,000 resistance against the US Dollar. BTC is consolidating gains above $11,200 and it could extend its rise to $12,000.
- Bitcoin started a strong increase after it cleared the $10,950 and $11,000 resistance levels.
- The price is now trading well above $11,200 and the 100 simple moving average (4-hours).
- There was a break above a major contracting triangle with resistance near $10,750 on the 4-hours chart of the BTC/USD pair (data feed from Kraken).
- The pair could correct lower, but buyers are likely to remain active near $11,200 and $11,000.
Bitcoin Turns Green
This past week, bitcoin made a few attempts to clear the $10,800 and $11,000 resistance levels against the US Dollar. Finally, the bulls gained strength and the price climbed sharply above $11,000.
The recent rally was initiated after there was a break above a major contracting triangle with resistance near $10,750 on the 4-hours chart of the BTC/USD pair. The upward move was such that the price even broke the $11,200 resistance.
It tested the $11,500 zone and a new monthly high is formed at $11,500. The price is now trading well above $11,200 and the 100 simple moving average (4-hours).
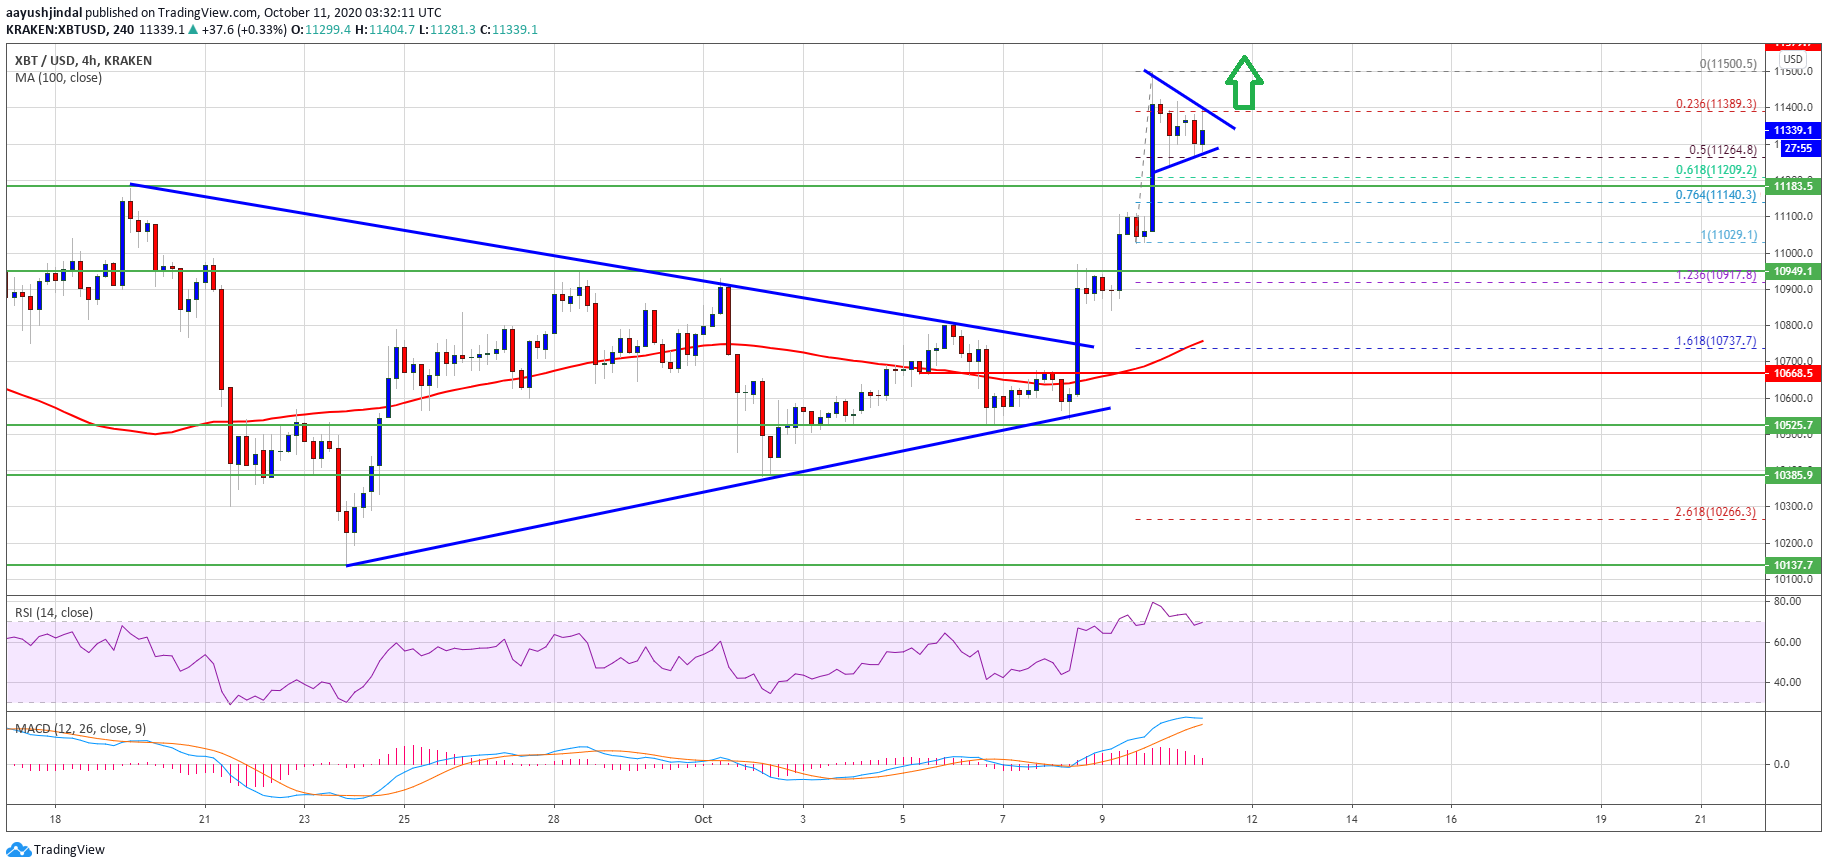
Bitcoin price rallies above $11,200. Source: TradingView.com
It seems like there is a short-term bullish continuation pattern forming with resistance near $11,400. On the downside, the triangle support is near $11,250 and the 50% Fib retracement level of the recent rally from the $11,029 swing low to $11,500 high.
If there is an upside break above the $11,400 level, the price is likely to clear the $11,500 high as well. The next major hurdle for the bulls is near the $11,800 level. Any further gains could lead bitcoin towards the $12,000 resistance level.
Downsides Could Be Limited in BTC
If bitcoin starts a downside correction, the triangle support at $11,250 might provide support. The next major support is near the $11,200 level or the 61.8% Fib retracement level of the recent rally from the $11,029 swing low to $11,500 high.
A downside break below the $11,250 and $11,200 support levels could start a steady decline towards the $11,000 support (key resistance turned support).
Technical indicators
4 hours MACD – The MACD for BTC/USD is showing positive signs in the bullish zone.
4 hours RSI (Relative Strength Index) – The RSI for BTC/USD is now above the 60 level.
Major Support Level – $11,200
Major Resistance Level – $11,400


