

After managing to retake $7,200 on the weekend, Bitcoin tumbled lower on Monday morning, falling in tandem with global markets as the coronavirus continues to ravage economies. As of the time of this article’s writing, BTC is trading at $6,840 — just under 7% below the weekend’s highs of $7,300 and nearly 9% below the $7,470 highs seen two weeks back at the highs.
The cryptocurrency is currently trying to hold $6,700-6,800, a key level as pointed out by many traders.
Due to this latest bout of weakness, long positions on BitMEX have been affected by the move. Per skew.com, which tracks the size of liquidations that take place on BitMEX, approximately $40 million worth of Bitcoin longs has been liquidated in the past ten hours, over the course of the move from $7,250 to just above $6,800.
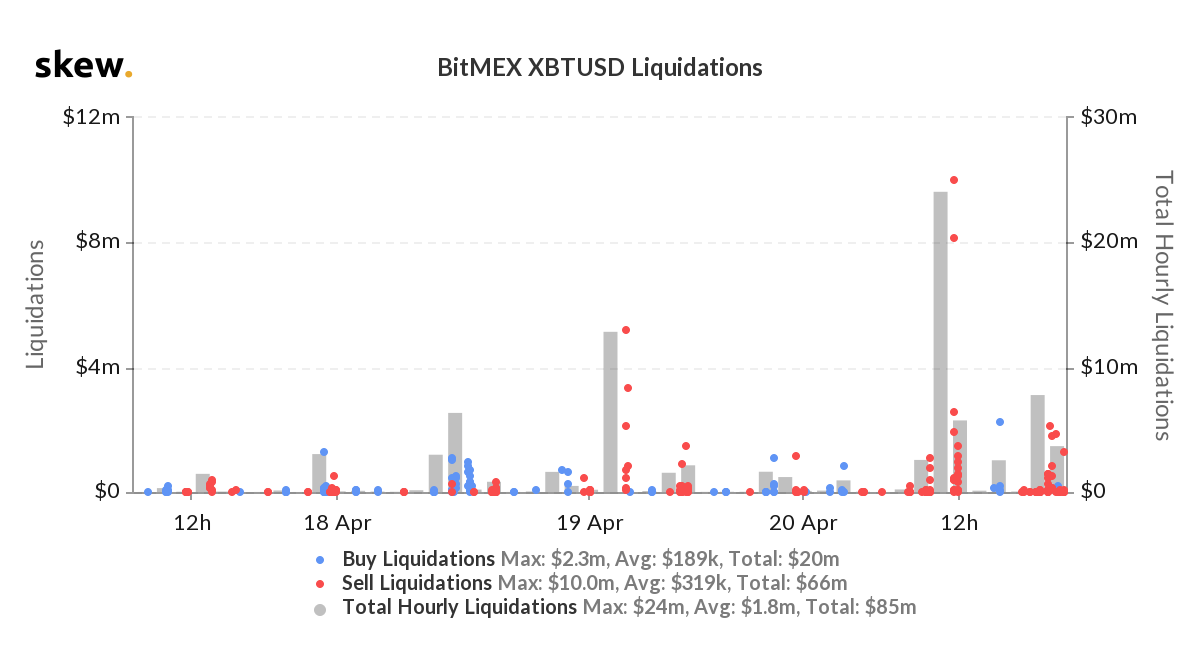
Simultaneously, open interest on BitMEX’s Bitcoin futures market has increased, suggesting traders are taking advantage of this move to lever themselves again. The predicted BitMEX funding rate is predicted to be negative, suggesting a short skew.
Bitcoin is Falling In Tandem With S&P 500, Oil
It seems once again that Bitcoin’s price action is basically a derivative of that of the U.S. stock market, which itself is being influenced by oil prices at the moment.
The S&P 500 is down 1.5% as of the time of this article’s writing, reversing from the local highs as demand for oil has evaporated, resulting in the price of light oil futures (for the May 2020 delivery), falling to a low of -$40 — yes, a negative price.
If stocks fall further from here, Bitcoin is unlikely to benefit. After all, the cryptocurrency, as found by the Federal Reserve’s Kansas City branch, has a running positive correlation with the S&P 500.
A Reversal Is Just Starting
Unfortunately, this may be just the start of a bigger reversal in the crypto market.
Avi Felman — a trader and analyst at crypto-asset fund BlockTower — observed two signs that a bearish reversal after the rally from $3,700 to $7,400 is likely:
- The Tom Demark Sequential just printed a “9” candle on the three-day chart for BTC. Previous “9” candles on this chart marked the mid-March bottom and the December 2019 bottom, but front-ran the $10,500 top seen earlier this year.
- Bitcoin has failed to break its three-day 50 and 200 simple moving average.
Furthermore, a trader noted that the average miner cash flow indicator, which predicts at which point miners are profitable, is currently acting as resistance for the BTC price. The same level marked the Bitcoin bottoms in 2019 and the one in 2018 down to a margin of error that only amounted to a couple of percentage points.
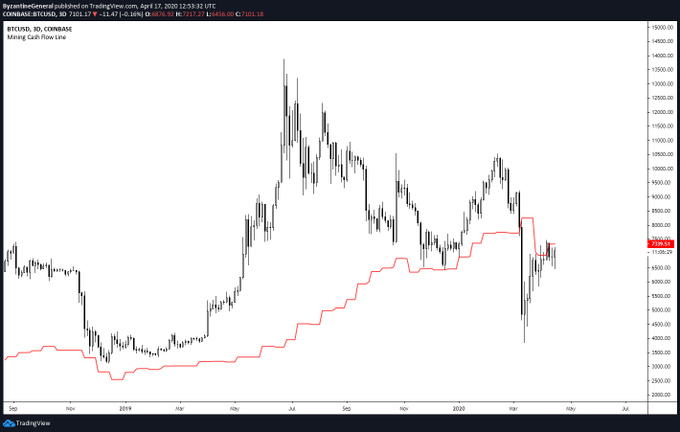
Photo by Matthew Henry on Unsplash


