

After trading below $9,000 for over a day, Bitcoin finally pushed past that level just minutes ago. BTC has not seen a massive rally from the weekly lows of $8,600, but $9,000 is a key technical and psychological resistance, analysts say, making the reclamation of the level that much more notable.
Bitcoin price chart from TradingView.com.
It’s been a slow rally for Bitcoin since the $8,600 lows, hence few positions have been liquidated on BitMEX.
According to crypto derivatives tracker Skew.com, approximately $2 million worth of BitMEX short positions have been liquidated on this swing higher. $2 million may sound like a lot, but it isn’t in a market with billions of dollars of transactions each day.
There hasn’t been a strong follow-through by bulls as Bitcoin has toyed with $9,000, leaving signs on the chart and on the blockchain that this upswing is not sustainable.
Reason #1: On-Chain Outlook Still Bearish for Bitcoin
According to IntoTheBlock — a blockchain intelligence firm — the on-chain and order book outlook for Bitcoin is currently “mostly bearish.”
Five out of seven of the firm’s proprietary indicators — including bid-ask imbalance, in the money, and large transactions — are currently in bearish territory, corroborating the downtrend that began last week.
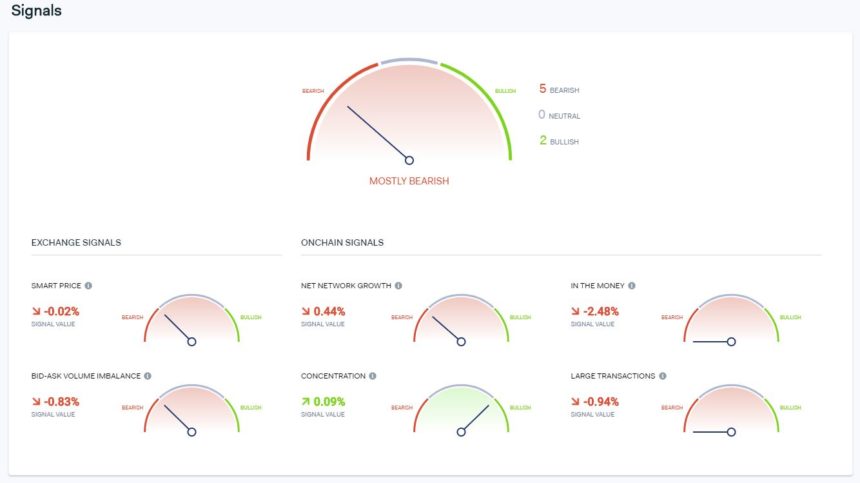
Data from IntoTheBlock
This has been corroborated by blockchain analytics firm Glassnode, which wrote:
“The GNI dropped 13 points this week and with $BTC no longer testing $10k, we may be seeing a regression back into bearish territory if Bitcoin’s on-chain activity and overall market health continue to decline.”
Reason #2: Miner Capitulation On the Horizon
Adding to the bear trend, there’s an ongoing miner capitulation event, which has been caused by the 50% reduction in block rewards.
Miners with tight margins due to high electricity costs and older mining machines have been forced to turn off their machines in the wake of the halving, driving hash rates lower.
It’s a decline that has been made clear by the Hash Ribbons — a custom indicator that tracks crosses in two moving averages of the hash rate.
On Monday morning, they confirmed a bearish cross — a sign seen just weeks before BTC crashed from $6,000 to $3,150 at the end of the 2018 bear market. Bearish crosses in the Hash Ribbons have also preceded previous drops in the Bitcoin price, suggesting the same could happen this time around.
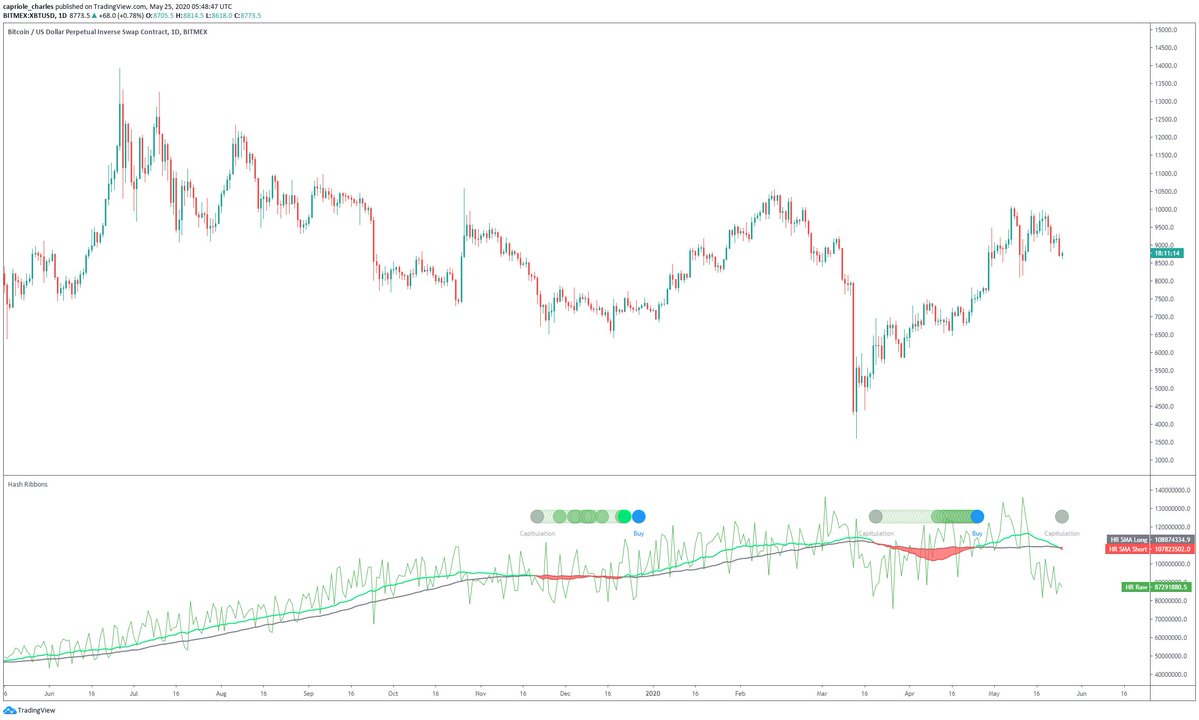
Bitcoin macro price chart with Hash Ribbons overlay from digital asset manager Charles Edwards
Featured Image from Shutterstock

 Crash")
