

Bitcoin is struggling to gain pace above $21,500 against the US Dollar. BTC must clear the $22,500 resistance zone to avoid a fresh decline in the near term.
- Bitcoin is struggling to gain pace above the $21,500 and $21,600 levels.
- The price is now trading above the $21,500 level and the 100 hourly simple moving average.
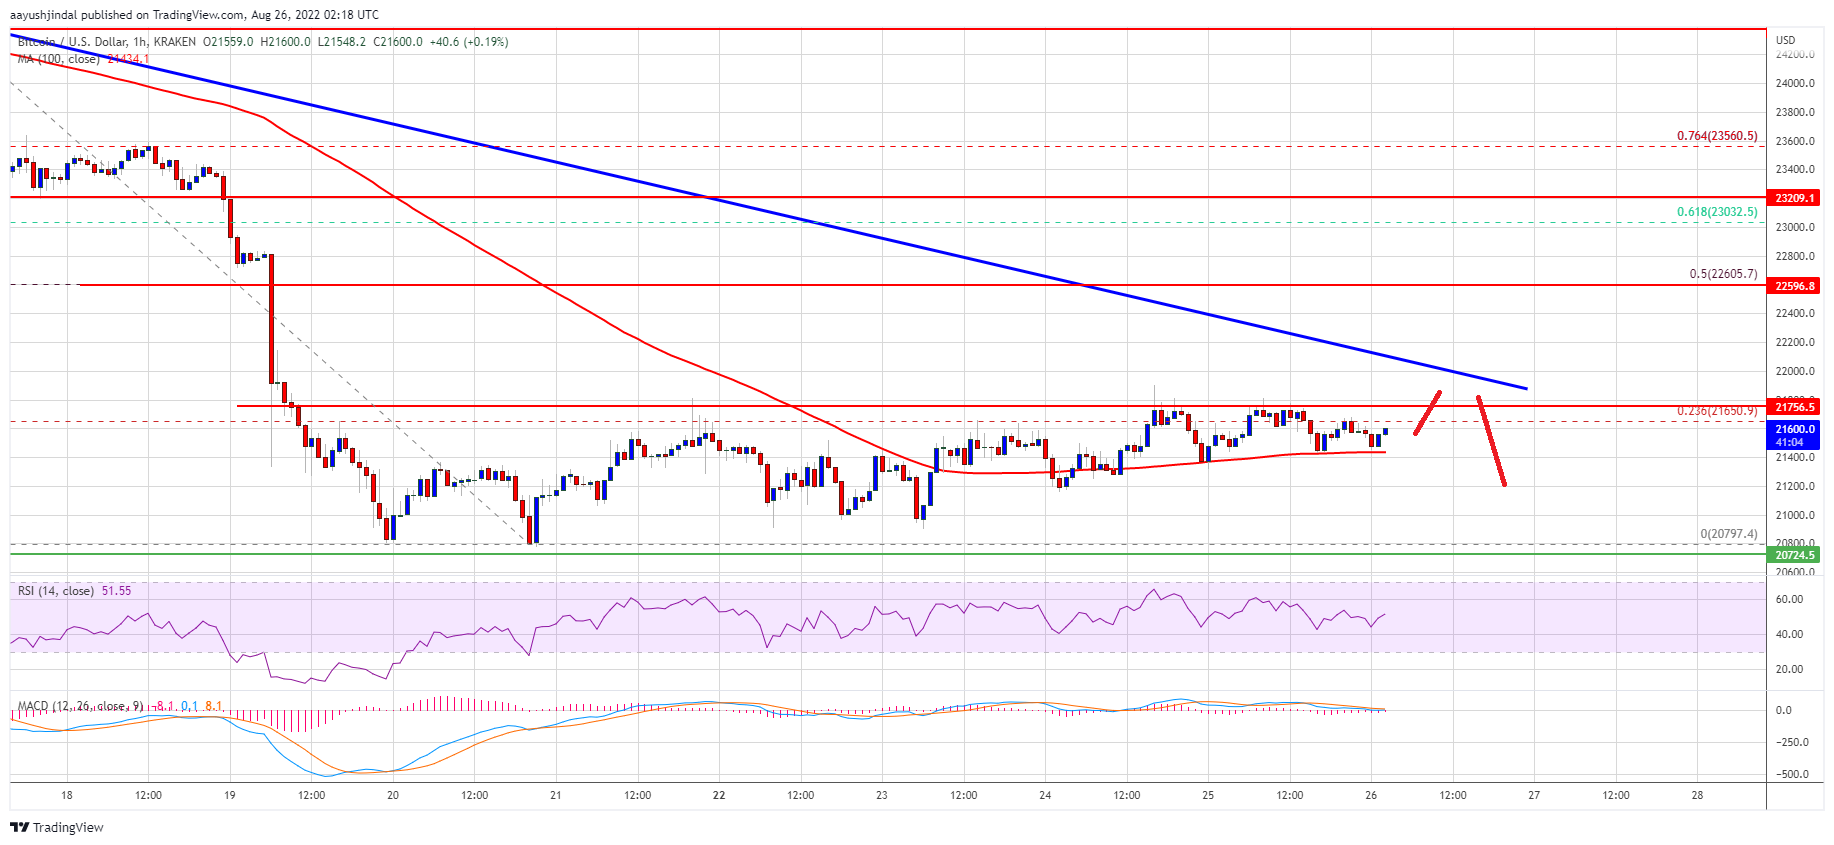
- There is a key bearish trend line forming with resistance near $22,000 on the hourly chart of the BTC/USD pair (data feed from Kraken).
- The pair could start a decent increase if there is a close above the $22,000 resistance zone.
Bitcoin Price Faces Hurdles
Bitcoin price started a minor upside correction from the $21,000 support zone. BTC was able to slowly move higher above the $21,250 and $21,500 levels.
The price even broke the $21,650 level and the 100 hourly simple moving average. There was a clear move above the 23.6% Fib retracement level of the downward move from the $24,416 swing high to $20,797 low. However, the bulls struggled to gain strength for a push towards the $22,000 resistance.
Bitcoin price is now trading above the $21,500 level and the 100 hourly simple moving average. On the upside, an immediate resistance is near the $21,750 and $21,800 levels.
The first major resistance on the upside sits near the $22,000 level. There is also a key bearish trend line forming with resistance near $22,000 on the hourly chart of the BTC/USD pair. A clear move above the trend line resistance might send the price towards the $22,500 zone.
Source: BTCUSD on TradingView.com
The next major resistance could be near the $22,650 zone. It is close to the 50% Fib retracement level of the downward move from the $24,416 swing high to $20,797 low. Any more gains might send the price towards the $24,000 resistance zone.
Fresh Decline in BTC?
If bitcoin fails to clear the $22,000 resistance zone, it could start another decline. An immediate support on the downside is near the $21,500 level and the 100 hourly simple moving average.
The next major support now sits near the $21,000 level. A close below the $21,000 support might start another decline in the near term. In the stated case, the price might decline towards the $20,000 level.
Technical indicators:
Hourly MACD – The MACD is now losing pace in the bullish zone.
Hourly RSI (Relative Strength Index) – The RSI for BTC/USD is now above the 50 level.
Major Support Levels – $21,500, followed by $21,000.
Major Resistance Levels – $21,750, $22,000 and $22,650.


