

- Bitcoin price is under pressure and it recently broke the $9,800 support area against the US Dollar.
- The price is currently consolidating losses below $9,800 and it remains at a risk of more downsides.
- There was a break below yesterday’s highlighted contracting triangle with resistance near $9,800 on the hourly chart of the BTC/USD pair (data feed from Kraken).
- The price could correct higher, but upsides are likely to remain capped near $9,850 and $9,950.
Bitcoin price is showing bearish signs below $10,000 against the US Dollar. BTC is likely to continue lower if it breaks the $9,600 low and $9,500.
Bitcoin Price Analysis
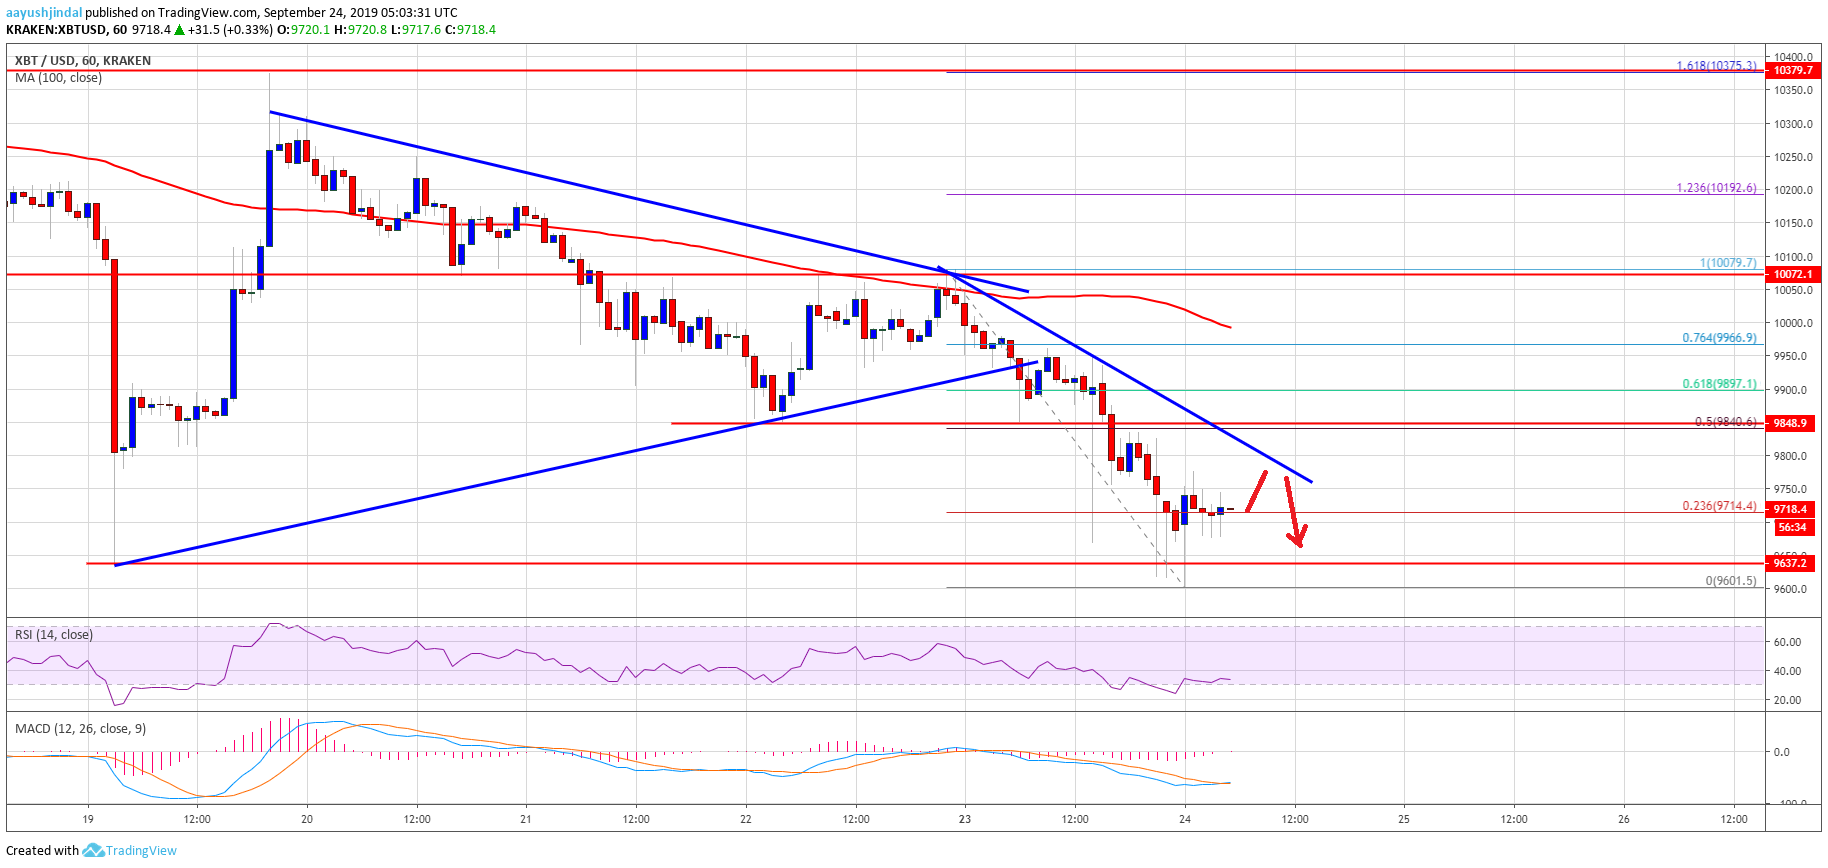
Yesterday, we discussed the chances of more downsides below $10,000 in bitcoin against the US Dollar. The price followed a bearish path and broke the $9,850 and $9,800 support levels. Moreover, there was a close below the $9,850 level and the 100 hourly simple moving average. Finally, the price spiked below the $9,650 support and a new weekly low was formed near $9,601.
More importantly, there was a break below yesterday’s highlighted contracting triangle with resistance near $9,800 on the hourly chart of the BTC/USD pair. At the moment, the price is consolidating losses above $9,600. It tested the 23.6% Fib retracement level of the recent slide from the $10,079 high to $9,601 low. An immediate resistance is near the $9,800 level.
There is also a connecting bearish trend line forming with resistance near $9,800 on the same chart. The key resistance is near the $9,850 level (the recent support). Additionally, the 50% Fib retracement level of the recent slide from the $10,079 high to $9,601 low is near the $9,850 level. If there is a break above $9,850, the price could test the $9,950 resistance area and the 100 hourly SMA.
To move into a positive zone, the price must settle above $10,000 and the 100 hourly SMA. Conversely, the price might continue to move down below $9,600. The next key support is near the $9,500 and $9,400 levels, below which there are chances of another slide towards the $9,200 level.
Looking at the chart, bitcoin price is showing a lot of bearish signs below $9,850 and $10,000. Therefore, there are high chances of more downsides below the $9,600 level. However, it won’t be easy for the bears to gain momentum below $9,500 in the near term. On the upside, the $10,000 level is now a solid resistance.
Technical indicators:
Hourly MACD – The MACD is likely to move back into the bullish zone.
Hourly RSI (Relative Strength Index) – The RSI for BTC/USD is currently correcting higher towards the 40 level.
Major Support Levels – $9,600 followed by $9,500.
Major Resistance Levels – $9,800, $9,850 and $9,950.


