

Bitcoin price declined over 10% and it traded close to the $10,000 support against the US Dollar. BTC might correct higher, but upsides are likely to remain capped near $10,800.
- Bitcoin started a strong decline and it weakened over $1,000 in the past three sessions.
- The price is down over 10%, and it broke the $10,500 support and the 100 hourly simple moving average.
- There is a key bearish trend line forming with resistance near $10,750 on the hourly chart of the BTC/USD pair (data feed from Kraken).
- The pair is currently consolidating losses near $10,250 and it might correct higher in the short-term.
Bitcoin Price Nosedives $1,000
Yesterday, we saw a sharp bearish wave in bitcoin price below the $11,500 support against the US Dollar. BTC remained in a bearish zone and it broke many supports such as $11,000 and $10,800.
The price is down over 10%, and it broke the $10,500 support and the 100 hourly simple moving average. A low is formed near $10,039 and the price is currently consolidating losses. An initial resistance on the upside is near the $10,400 level.
The 23.6% Fib retracement level of the recent drop from the $11,484 high to $10,039 low is near the $10,380 level to act as a resistance. The next key resistance is near the $10,500 level (a multi-touch zone).
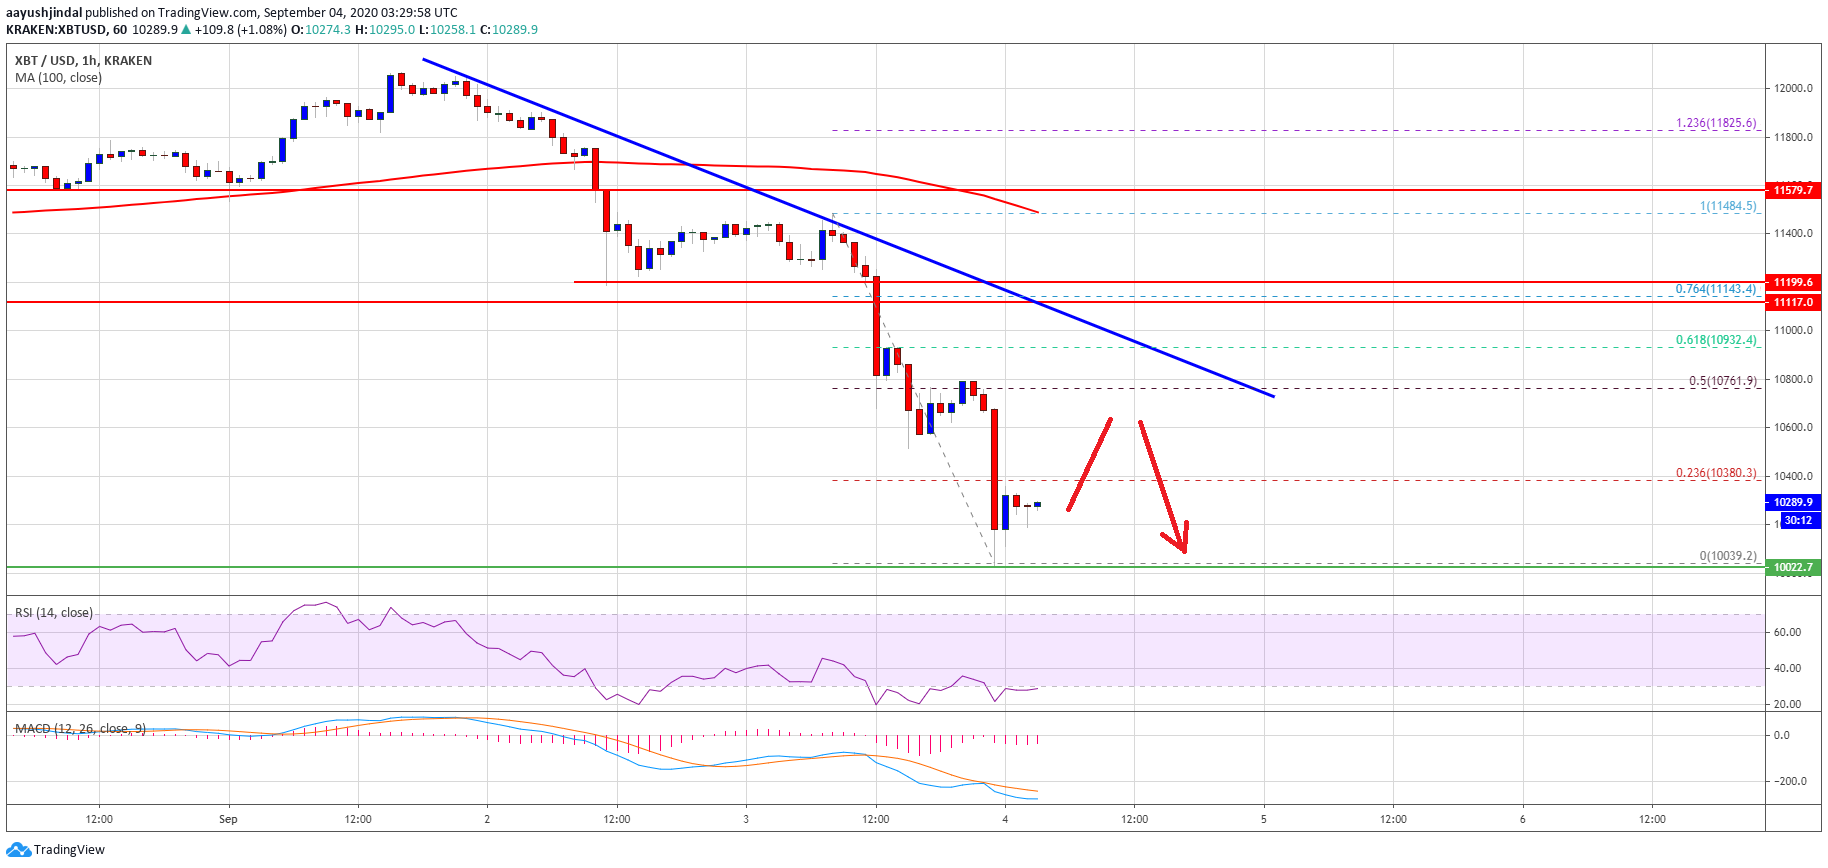
Bitcoin price trades below $10,500. Source: TradingView.com
The main resistance is now forming near the $10,800 level. There is also a key bearish trend line forming with resistance near $10,750 on the hourly chart of the BTC/USD pair. The trend line is close to the 50% Fib retracement level of the recent drop from the $11,484 high to $10,039 low.
A successful break above the $10,500 level and then a follow up move above the $10,800 level is needed to move back into a positive zone in the near term.
More Losses in BTC
If bitcoin price struggles to clear the $10,500 resistance, it might continue to move down. The first key support for the bulls is near the $10,050 level.
The main support is near the $10,000 area, below which there is an open space and the price might decline another 5%-10%.
Technical indicators:
Hourly MACD – The MACD is slowly losing momentum in the bearish zone.
Hourly RSI (Relative Strength Index) – The RSI for BTC/USD is now well below the 40 level.
Major Support Levels – $10,050, followed by $10,000.
Major Resistance Levels – $10,400, $10,500 and $10,800.


