

Bitcoin is currently correcting higher from $8,645 against the US Dollar. BTC price needs to clear the $9,100 resistance area to start a strong upward move and avoid a major downtrend.
- Bitcoin is facing a couple of key hurdles near the $9,000 and $9,100 levels.
- The price must settle above the 100 hourly simple moving average to avert more losses.
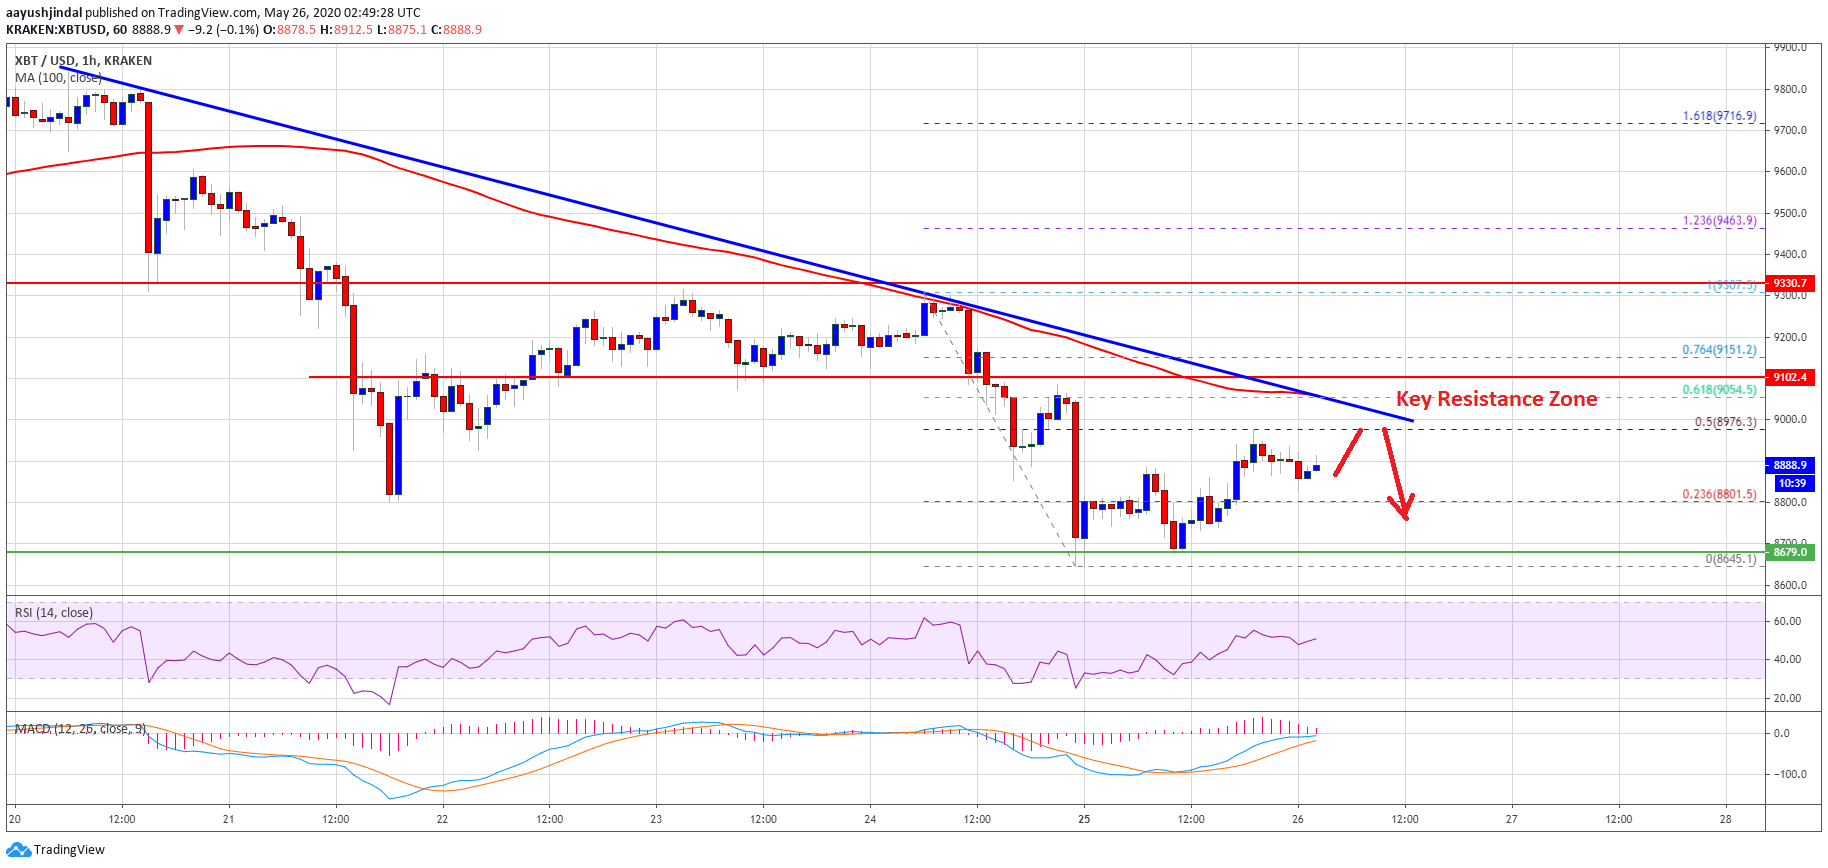
- There is a key bearish trend line forming with resistance near $9,050 on the hourly chart of the BTC/USD pair (data feed from Kraken).
- The pair could resume its decline below $8,645 if it struggles to clear the $9,100 resistance.
Bitcoin Facing Hurdles
Bitcoin price extended its decline below the $9,000 support against the US Dollar. BTC price even settled below the 100 hourly simple moving average and traded to a new weekly low at $8,645.
It is currently correcting higher and trading above $8,800. The bulls pushed the price above the $8,900 level, but they struggled to clear the $8,975-$9,000 resistance. It seems like the 50% Fib retracement level of the downward move from the $9,307 high to $8,645 low is acting as a resistance.
There is also key bearish trend line forming with resistance near $9,050 on the hourly chart of the BTC/USD pair. The trend line is close to the 61.8% Fib retracement level of the downward move from the $9,307 high to $8,645 low.
Bitcoin
More importantly, the 100 hourly simple moving average is positioned near the trend line and $9,100. If the bulls manage to clear the trend line resistance, 100 hourly SMA, and $9,100, there are chances of a strong upward move.
The next key resistance is near the $9,330 level (a key breakdown zone), above which the price might rise steadily towards the $9,800 and $9,950 resistance levels in the near term.
More Downsides in BTC?
If bitcoin price fails to break the $9,100 resistance and the 100 hourly SMA, it could resume its decline. An initial support on the downside is seen near the $8,800 level.
A downside break below the $8,800 support might push the price towards the $8,650 and $8,500 levels. Any further losses may perhaps open the doors for a larger decline in the coming sessions towards $8,200 and $8,000.
Technical indicators:
Hourly MACD – The MACD is currently losing momentum in the bullish zone.
Hourly RSI (Relative Strength Index) – The RSI for BTC/USD is rising and it is just above the 50 level.
Major Support Levels – $8,800 followed by $8,650.
Major Resistance Levels – $9,000, $9,050 and $9,100.


