

Bitcoin has entered a period of consolidation after peaking at $15,975 late last week.
The cryptocurrency has bounced between those highs and lows around $14,500 due to volatility in the price of the U.S. dollar and other macro markets. Investors around the world are trying to grapple with a Biden presidency and the news that a vaccine for the pandemic is potentially right around the corner.
While Bitcoin remains close to the highs, the asset is nearing an important technical support level that was formed in September.
This technical level is important as if the leading cryptocurrency does lose it, a strong correction could follow suit. The technical level is a parabolic uptrend, which suggests a correction could result in a 60-80 percent correction of the move higher.
Related Reading: Here’s Why Ethereum’s DeFi Market May Be Near A Bottom
Bitcoin Is Testing a Pivotal Support Level
Bitcoin’s rally over the past few weeks has often been described as a parabola. When an asset rallies 50% in the span of a month, what else are you supposed to call it?
Although consolidation is to be expected, Bitcoin is on the verge of testing the support of the parabola that formed in early September to bring it this high.
Crypto-asset analyst Tyler D. Coates shared the chart seen below on November 9th, depicting this playing out.
Should Bitcoin lose the parabola, conventional technical analysis wisdom would suggest the cryptocurrency could retrace 60-80% of the parabolic move higher. Applied to Bitcoin’s current situation, that would suggest a move toward the $11,000-12,000 region, which analysts say Bitcoin should reconfirm as support before heading higher.
Fortunately for bulls, the chart also suggests that bitcoin is in the midst of forming an ascending triangle pattern that matches up almost perfectly with the parabola. Ascending triangles are bullish chart patterns often spotted in bull markets. They often break higher after an asset trades in a tightening range.
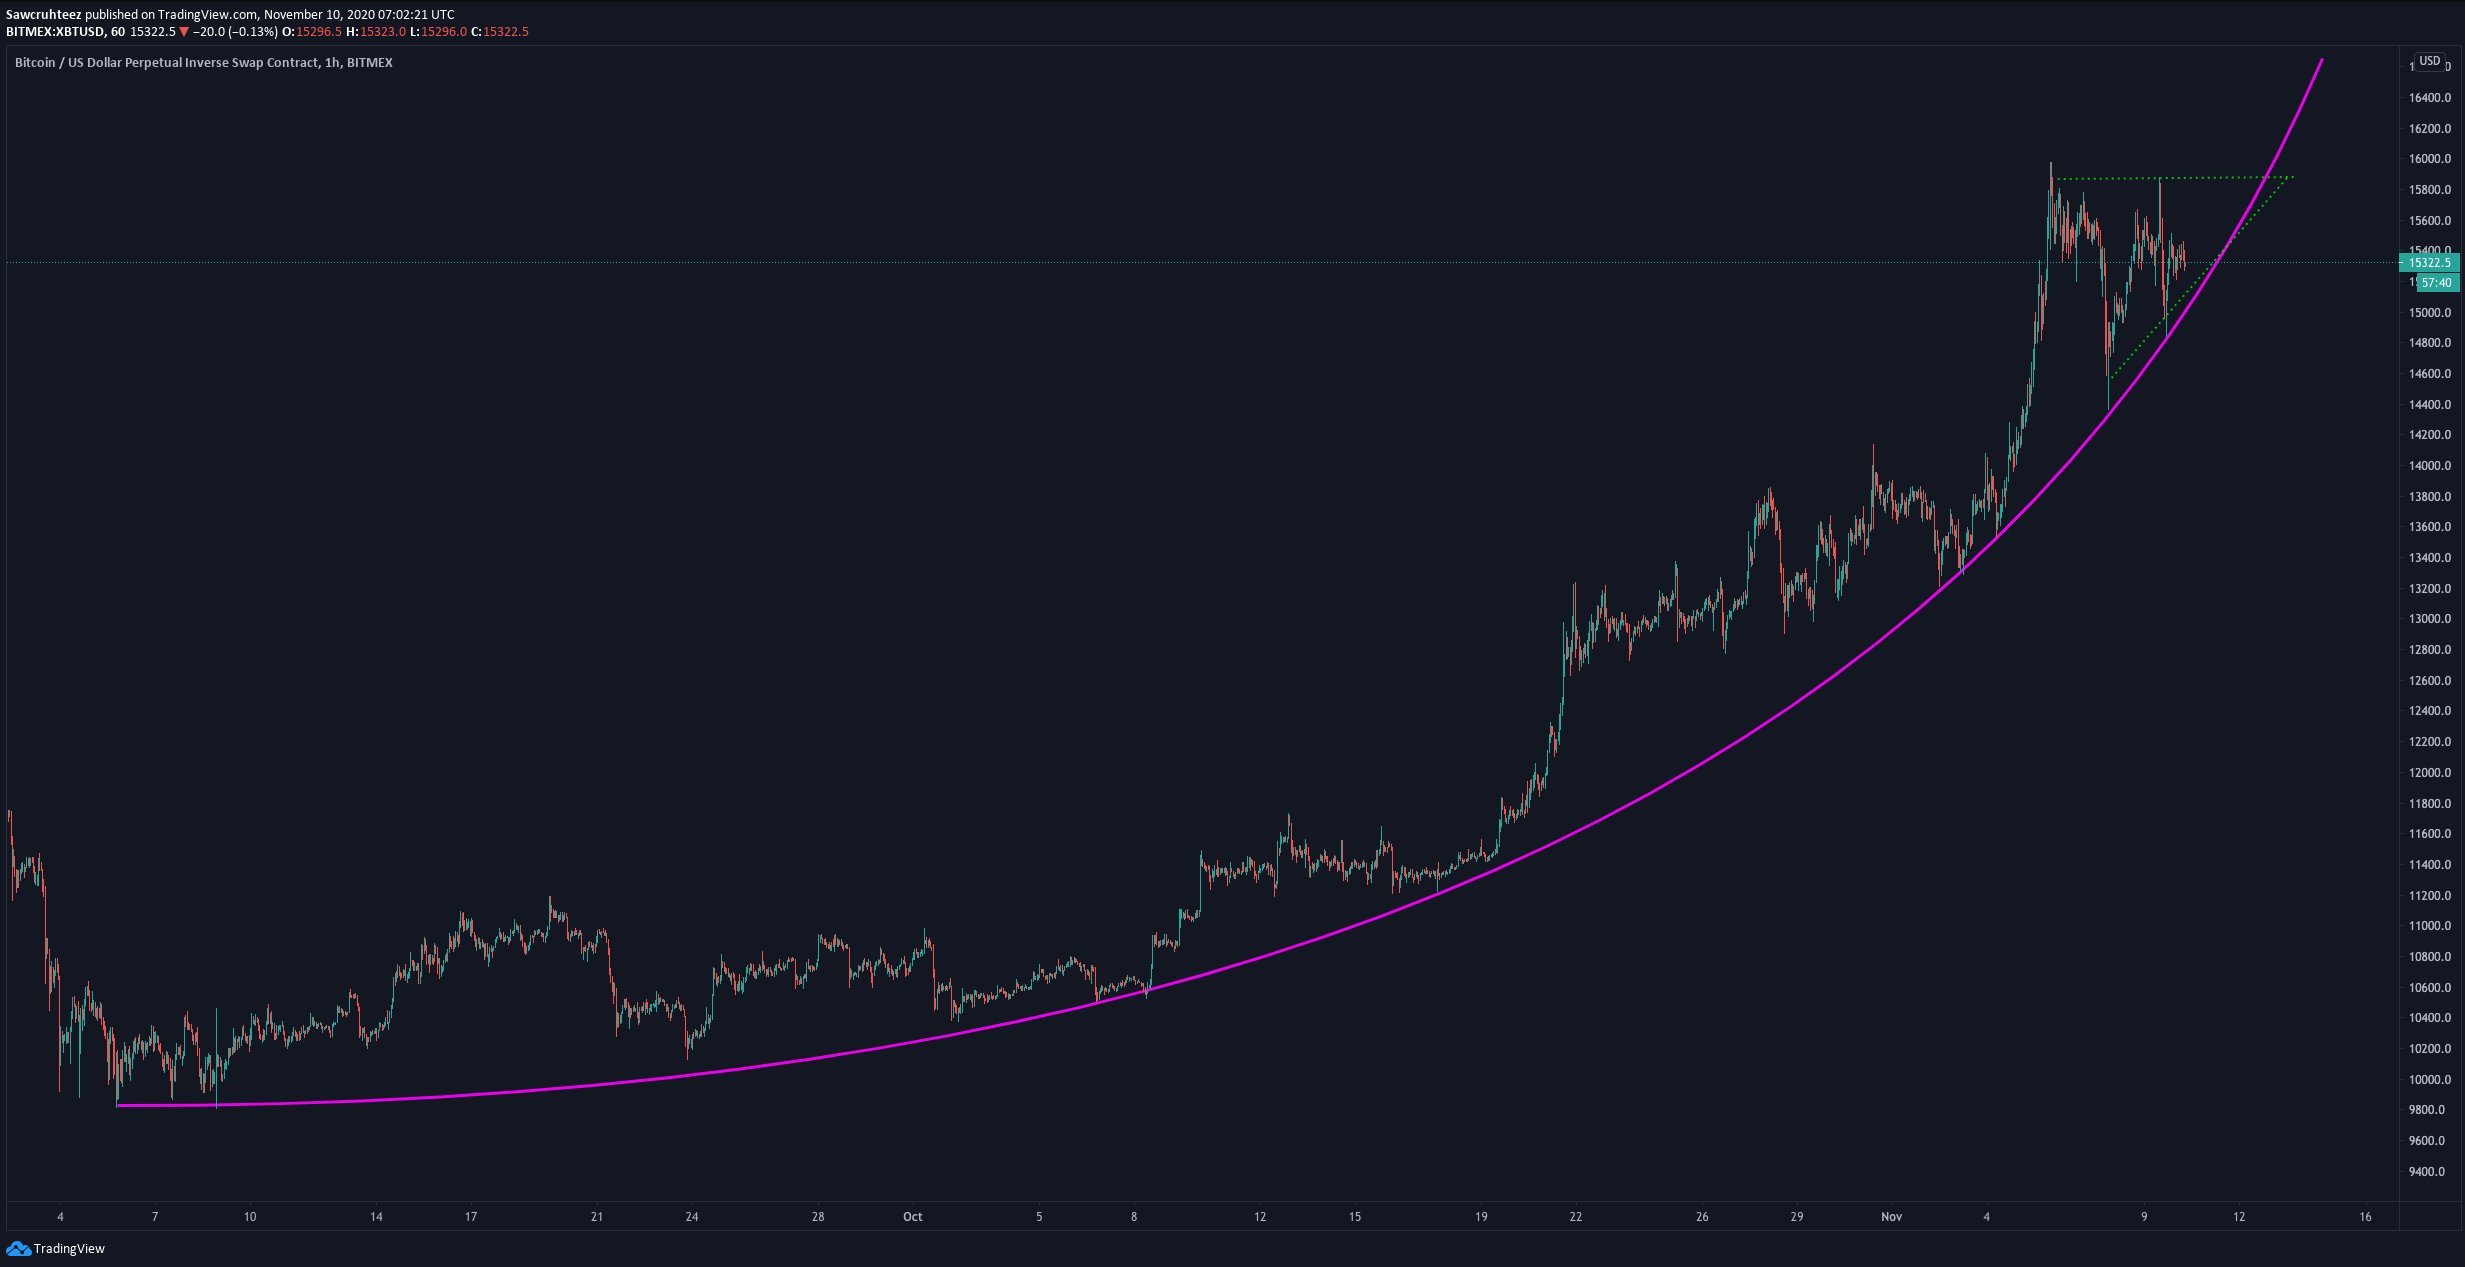
Chart of BTC's price action over the past three months with analysis by crypto trader Tyler Coates (@Sawcruhteez on Twitter).
Source: BTCUSD from TradingView.com
Related Reading: Tyler Winklevoss: A “Tsunami” of Capital Is Coming For Bitcoin
Analysts Remain Optimistic
Analysts are optimistic about Bitcoin’s prospects here.
One trader recently said that he is eyeing a move toward $17,000 or $18,000 as Bitcoin holds key support levels on a weekly basis:
“I think there’s a decent chance bitcoin breaches $17k and even into $18k in the next 10 days (next weekly candle). We are due for a decent mid timeframe blowoff and chill for a bit and wicking into the ATH cluster just feels so right… The path to $18k or ATH wick seems the path of least resistance. Nobody wants to sell until then and everybody is buying dips. Easiest way to create market balance is to do it quickly then let the market chop around a bit.”
There are also fundamental news events like billionaire investor Stanley Druckenmiller supporting Bitcoin that should drive a move higher.
Related Reading: 3 Bitcoin On-Chain Trends Show a Macro Bull Market Is Brewing
Featured Image from Shutterstock
Price tags: xbtusd, btcusd, btcusdt
Charts from TradingView.com
Eyes on the Charts: Bitcoin Is Testing a Support Level Formed in Early September


