

Bitcoin is currently trading in a broad range above the $6,500 support against the US Dollar. BTC is facing a major resistance near $7,500 and the 100-day simple moving average.
- Bitcoin is still in a larger downtrend below the $7,500 resistance against the US Dollar.
- The price is currently consolidating above the $6,500 support area.
- There is a major bearish trend line forming with resistance near $7,580 on the daily chart of the BTC/USD pair (data feed from Kraken).
- The bulls are likely to face a strong resistance near $7,500 and the 100-day simple moving average.
Bitcoin Price is Approaching Major Hurdle
In the past few days, bitcoin mostly traded in a broad range above the $6,400 and $6,500 support levels against the US Dollar. BTC price seems to be well bid above the $6,500 level, but it is facing a lot of hurdles on the upside.
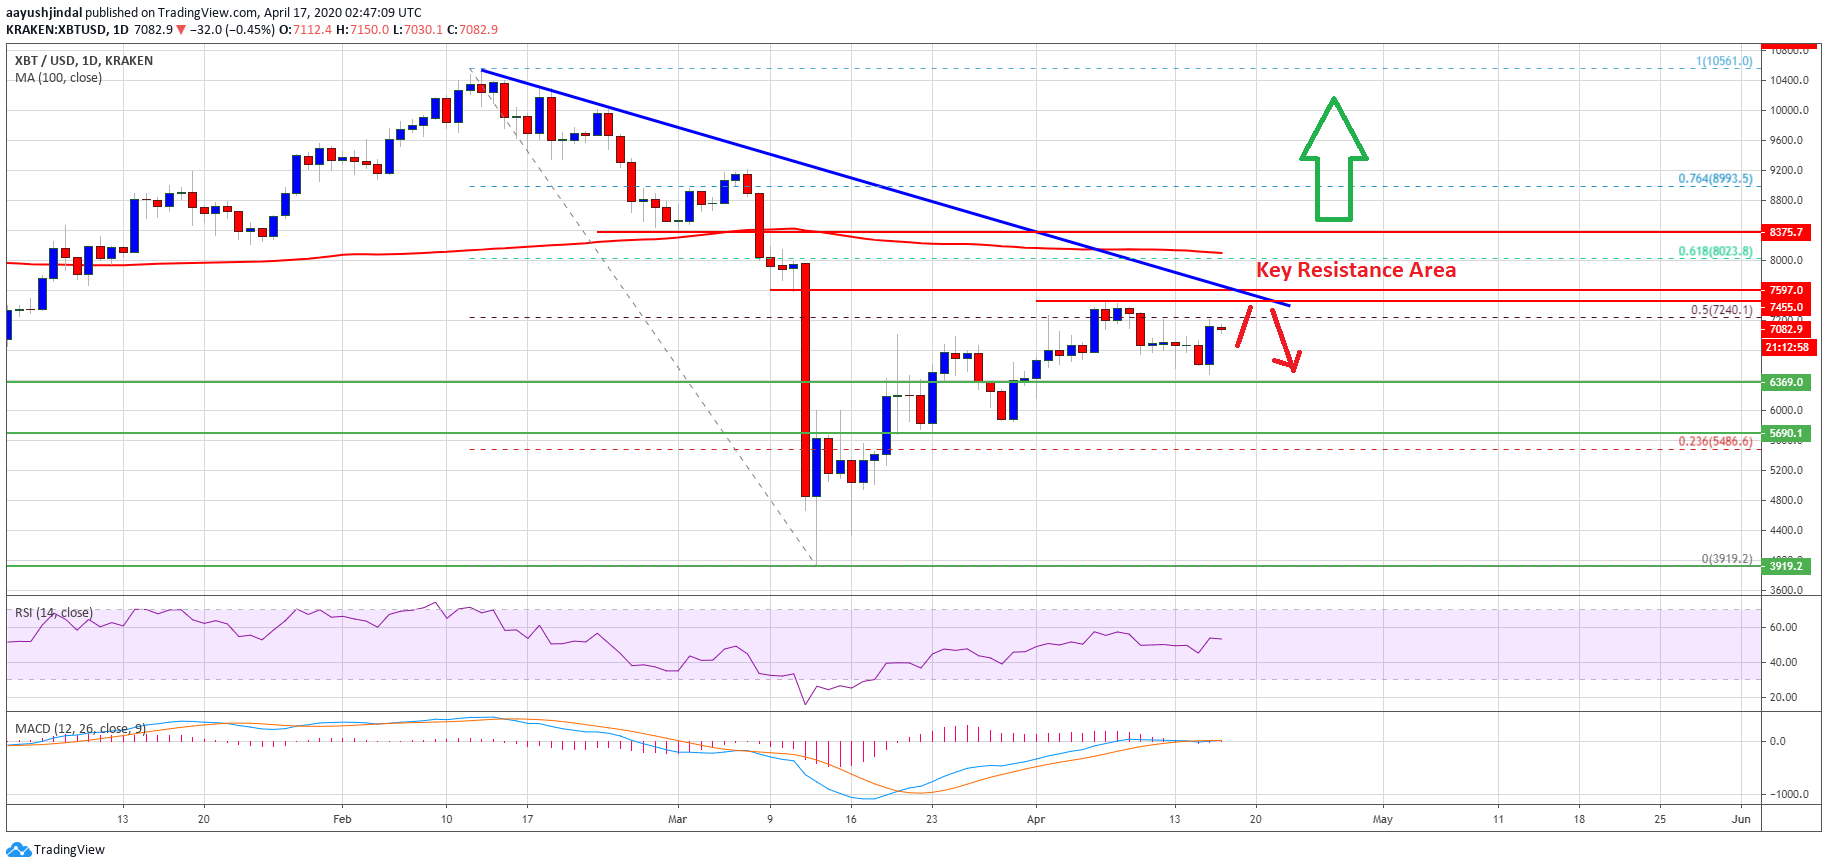
The first key resistance is near the $7,240 level. It represents the 50% Fib retracement level of the crucial drop from the $10,561 high to $3,920 swing low. The bulls already made an attempt to clear the $7,240 resistance, but they failed.
More importantly, there is a major bearish trend line forming with resistance near $7,580 on the daily chart of the BTC/USD pair. Above the trend line, the next key resistance area is visible near the $8,000 level and the 100-day simple moving average.
The 61.8% Fib retracement level of the crucial drop from the $10,561 high to $3,920 swing low is also near the $8,000 resistance area. Therefore, bitcoin seems to be facing two major hurdles near $7,500 and $8,000.
To move into a strong uptrend, the bulls need to gain strength above $7,500, with a follow up move above the $8,000 barrier. If they succeed, the price could surge towards the $9,500 and $10,000 levels in the coming days.
Fresh Decline?
If bitcoin price fails to continue above the $7,500 resistance or the $8,000 barrier, it could start a fresh decline. An initial support on the downside is near the $6,400 level.
If the price fails to stay above the $6,400 support, it may perhaps retest the $6,000 support. Any further losses could start another significant decline towards the $5,000 support area in the near term.
Technical indicators:
Daily MACD – The MACD is struggling to gain momentum in the bullish zone.
Daily RSI (Relative Strength Index) – The RSI for BTC/USD is now just above the 50 level.
Major Support Levels – $6,400 followed by $6,000.
Major Resistance Levels – $7,240, $7,500 and $8,000.
Image from unsplash.
 Price Recovery Could Fade, Fresh Decrease Likely")

