

Bitcoin is likely forming a short term bottom near $8,400 against the US Dollar. However, BTC price must climb above the 100 hourly SMA and $8,800 to start a fresh increase.
- Bitcoin is currently consolidating above the $8,400 and $8,500 support levels against the US Dollar.
- The bulls need to gain control above $8,700 and the 100 hourly simple moving average.
- There was a break above a key bearish trend line with resistance near $8,575 on the hourly chart of the BTC/USD pair (data feed from Kraken).
- The pair could start a strong increase if it settles above $8,700 and $8,800.
Bitcoin Reaching Key Resistance
This past week, we saw a steady decline below the $9,000 support in bitcoin against the US Dollar. BTC price made a couple of attempts to bounce back, but it failed and settled below the 100 hourly simple moving average.
On the downside, it seems like the price is finding a significant buying interest near the $9,500 and $9,400 levels. The recent low was formed near $8,403 and the price is currently correcting higher.
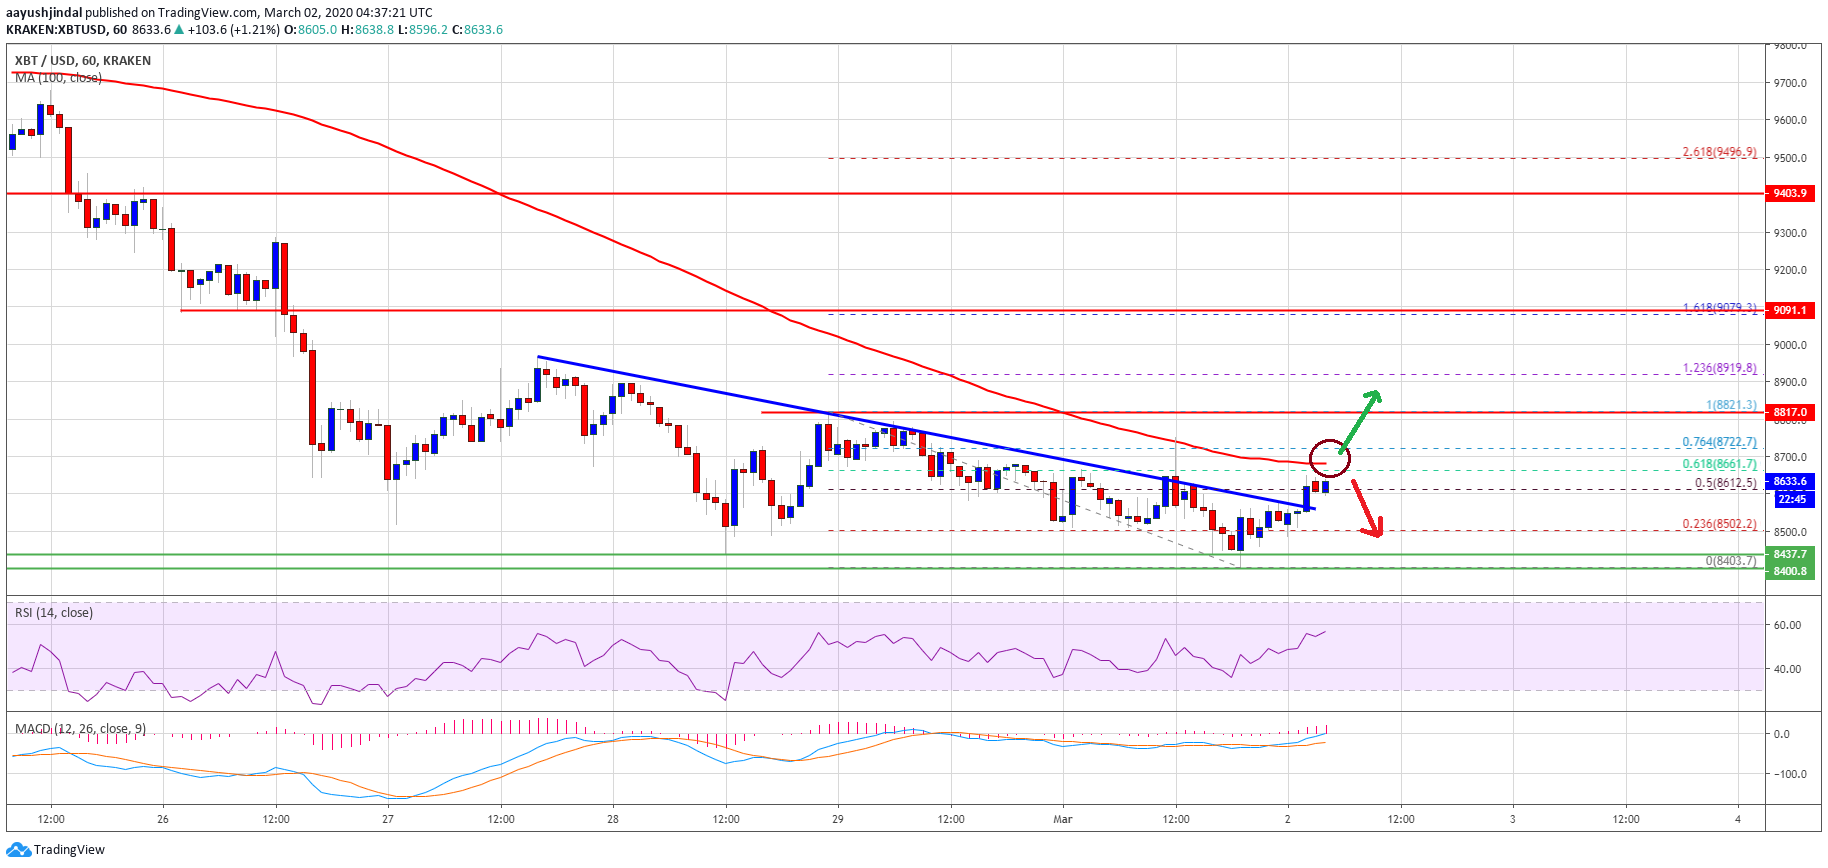
It is trading above the $8,450 and $8,500 levels. More importantly, there was a break above a key bearish trend line with resistance near $8,575 on the hourly chart of the BTC/USD pair. It has opened the doors for more gains above the $8,600 level.
The pair is now trading near the 50% Fib retracement level of the recent decline from the $8,821 high to $8,403 low. On the upside, an initial resistance is seen near the $8,660 level and the 100 hourly simple moving average.
The 61.8% Fib retracement level of the recent decline from the $8,821 high to $8,403 low is also near the $8,660 level to prevent gains. If bitcoin price climbs above the $8,700 level and the 100 hourly SMA, there are chances of a decent upward move.
The next key resistance is near the $8,800 area, above which the bulls are likely to take control. In the stated bullish scenario, the price is likely to recover above $9,000 or even $9,200 in the coming sessions.
Downside Break?
If bitcoin fails to climb above the $8,700 level or the 100 hourly SMA, there is a risk of another bearish reaction. On the downside, there are two key supports – $8,500 and $8,400.
A downside break below the $8,403 low may perhaps lead the price towards the next set of important supports near $8,200 and $8,000 (as discussed in one of the analyses using the daily chart).
Technical indicators:
Hourly MACD – The MACD is slowly moving in the bullish zone.
Hourly RSI (Relative Strength Index) – The RSI for BTC/USD is back above the 50 level.
Major Support Levels – $8,500 followed by $8,400.
Major Resistance Levels – $8,700, $8,800 and $9,000.


