

Bitcoin is currently recovering from the $8,512 weekly low against the US Dollar. However, BTC price is still facing many key hurdles near $9,000 and it could resume its decline.
- Bitcoin is showing signs of a short term upside correction from $8,512 against the US Dollar.
- The bears are still in control unless there is a clear break above $9,000 and $9,200.
- There is likely a bearish flag forming with support near $8,735 on the hourly chart of the BTC/USD pair (data feed from Kraken).
- The pair could resume its decline below the $8,735 and $8,600 levels in the near term.
Bitcoin Is Facing Key Hurdles
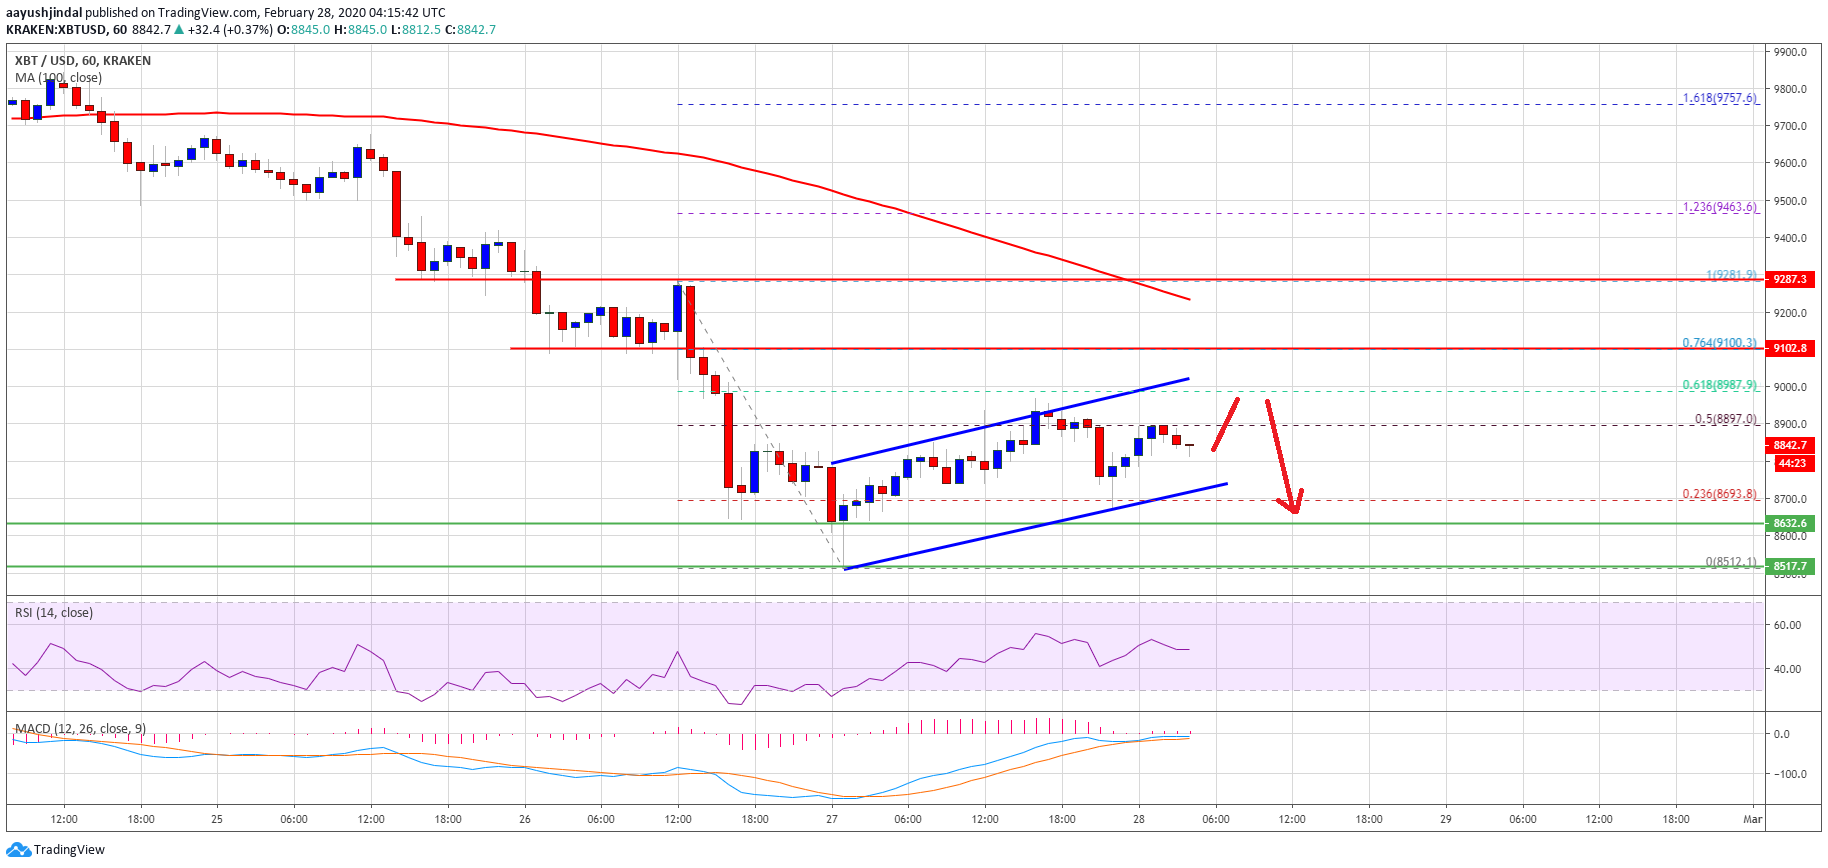
This week, we saw a strong downward move in bitcoin below $9,000 and $8,800 against the US Dollar. BTC price even traded below the $8,680 support level and settled well below the 100 hourly simple moving average.
A new weekly low is formed near $8,512 and the price is currently correcting losses. It surpassed the $8,700 resistance level, and the 23.6% Fib retracement level of the downward move from the $9,281 high to $8,512 low.
On the upside, there are many resistances forming near the $9,000 and $9,200 levels. More importantly, there is likely a bearish flag forming with support near $8,735 on the hourly chart of the BTC/USD pair.
Bitcoin is currently struggling near the 50% Fib retracement level of the downward move from the $9,281 high to $8,512 low. The first key resistance is near the flag resistance at $9,000.
If the bulls gain strength above $9,000, the next important breakout zone is visible near the $9,200 level and the 100 hourly SMA. Therefore, the price must climb above the $9,000 and $9,200 levels to start a fresh increase in the coming sessions.
Fresh Drop
If bitcoin fails to correct above the $9,000 and $9,200 resistance levels, it is likely to resume its decline. An initial support is near the flag trend line at $8,735.
A successful break below the flag support could open the doors for a fresh decline below $8,700 and $8,600. In the mentioned case, the price could even decline below the $8,512 swing low.
The next major support and buy zone is near the $8,200 level (as discussed yesterday using the daily chart). In the medium term, bitcoin price is likely to bounce back as long as there is no daily close below $8,000.
Technical indicators:
Hourly MACD – The MACD is slowly moving in the bullish zone.
Hourly RSI (Relative Strength Index) – The RSI for BTC/USD is currently just below the 50 level.
Major Support Levels – $8,735 followed by $8,500.
Major Resistance Levels – $9,000, $9,200 and $9,280.

 Staging Another Dip Before It Could Recover")
