

Bitcoin is currently declining and trading well below $9,500 against the US Dollar. BTC is likely to continue lower and it seems like the bears are aiming a break below $9,100 and $9,000.
- Bitcoin is facing an increase in selling pressure below the $9,500 pivot level.
- The price failed to clear the $9,540 resistance zone and it is currently declining.
- There is a key bearish trend line forming with resistance near $9,400 on the hourly chart of the BTC/USD pair (data feed from Kraken).
- The pair could continue to move down and it is likely to break the $9,100 support.
Bitcoin Price Could Extend Losses
After a sharp decline, bitcoin price started an upside correction from the $9,100 support against the US Dollar. BTC managed to stay above the $9,000 handle and recovered above the $9,300 resistance level.
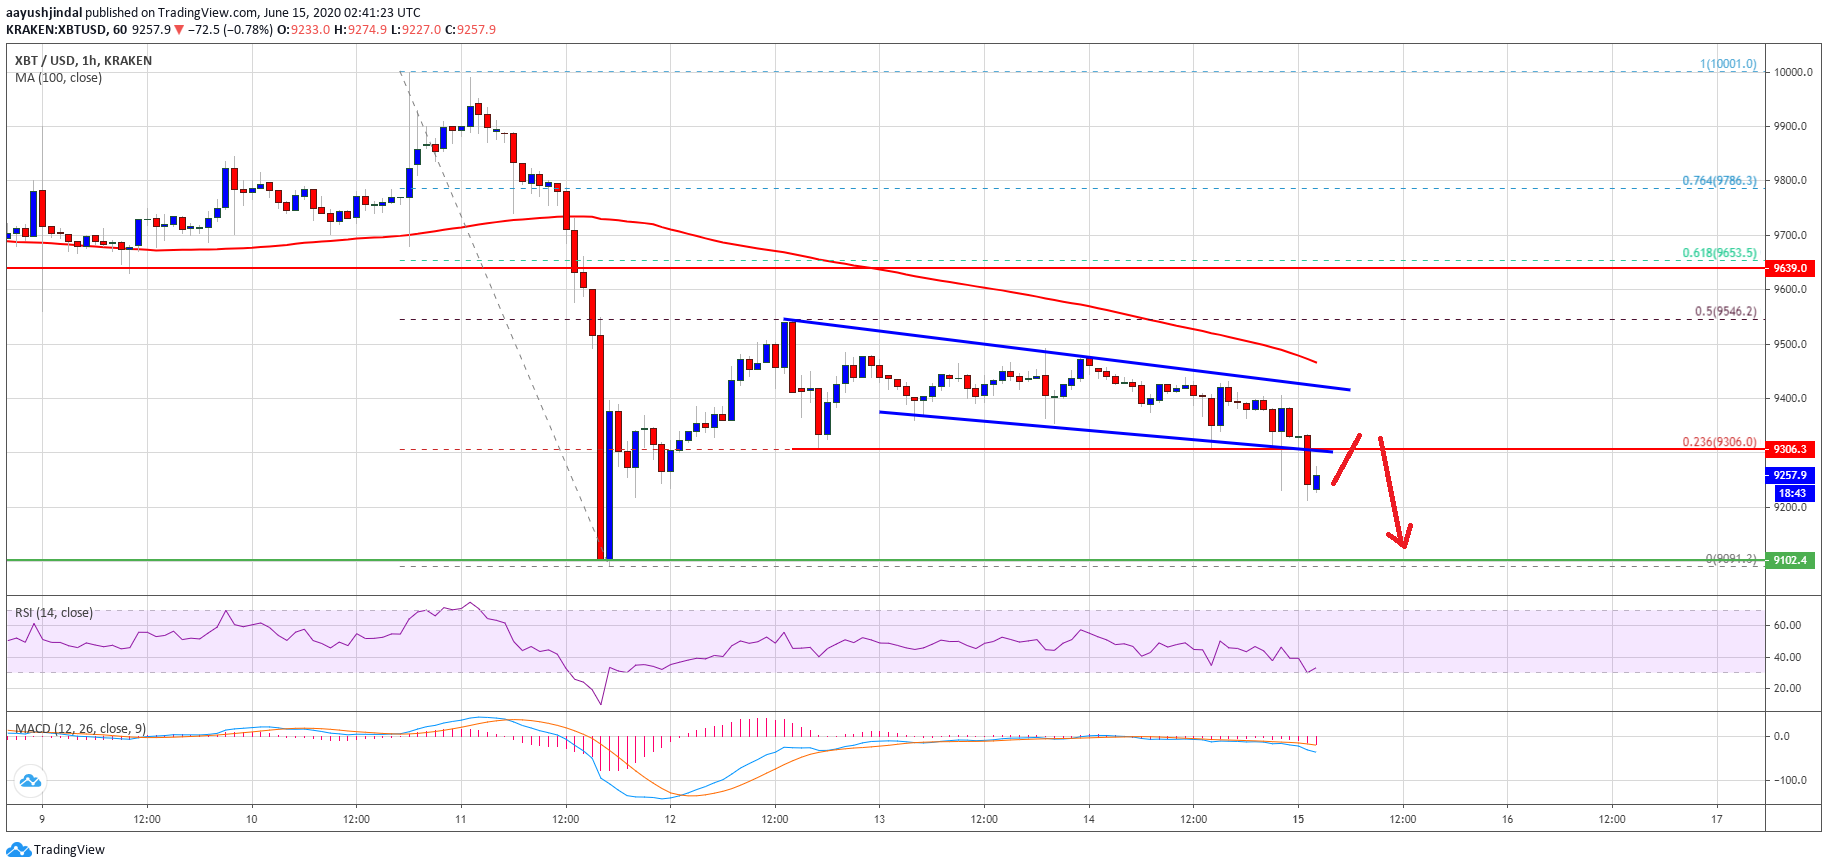
There was a break above the 23.6% Fib retracement level of the downward move from the $10,000 swing high to $9,090 low. It even moved above the $9,500 level, but failed to surpass the $9,540 resistance level.
It seems like the price failed to clear the 50% Fib retracement level of the downward move from the $10,000 swing high to $9,090 low. Bitcoin is currently declining and trading well below the $9,500 and $9,400 levels.
There is also a key bearish trend line forming with resistance near $9,400 on the hourly chart of the BTC/USD pair. The current price action suggests that the pair could continue to move down towards the $9,100 support zone in the near term.
If the bears remain in action in the coming sessions, there are chances of more losses below the $9,090 swing low. The next major support is near the $9,000 level, below which the price could revisit the $8,800 support level.
Chances of a Fresh Recovery in BTC
On the upside, bitcoin price is facing a lot of hurdles near $9,300 and $9,400. Besides, the 100 hourly simple moving average is also near the $9,500 level.
Therefore, the price must move above the $9,500 resistance zone and settle above the 100 hourly simple moving average to start a fresh upward move. The next major resistance above $9,500 might be $9,800.
Technical indicators:
Hourly MACD – The MACD is currently gaining momentum in the bearish zone.
Hourly RSI (Relative Strength Index) – The RSI for BTC/USD is now close to the 30 level.
Major Support Levels – $9,100 followed by $9,000.
Major Resistance Levels – $9,300, $9,400 and $9,500.

 Price Teases $38K Again as Fed Members Publicly Disagree on Economic Outlook")
