

Bitcoin is down more than 10% from the $10,090 high against the US Dollar. BTC found support near the 100-day simple moving average and it could start a fresh increase.
- Bitcoin climbed to a new monthly high at $10,097 before starting a downside correction.
- The recent pre-halving dump found support near the 100-day simple moving average.
- There is a major bullish trend line forming with support near $8,000 on the daily chart of the BTC/USD pair (data feed from Kraken).
- Ethereum and ripple are also down more than 10% and both declined below key supports.
Bitcoin Dives Before Halving
This past week, bitcoin price extended its rally above the $9,200 resistance against the US Dollar. BTC price even broke the $9,500 resistance and settled well above the 100-day simple moving average.
It traded above the $10,000 level and formed a new monthly high at $10,097. It started a strong decline from the $10,097 high and broke many supports near the $9,500 and $9,200 levels.
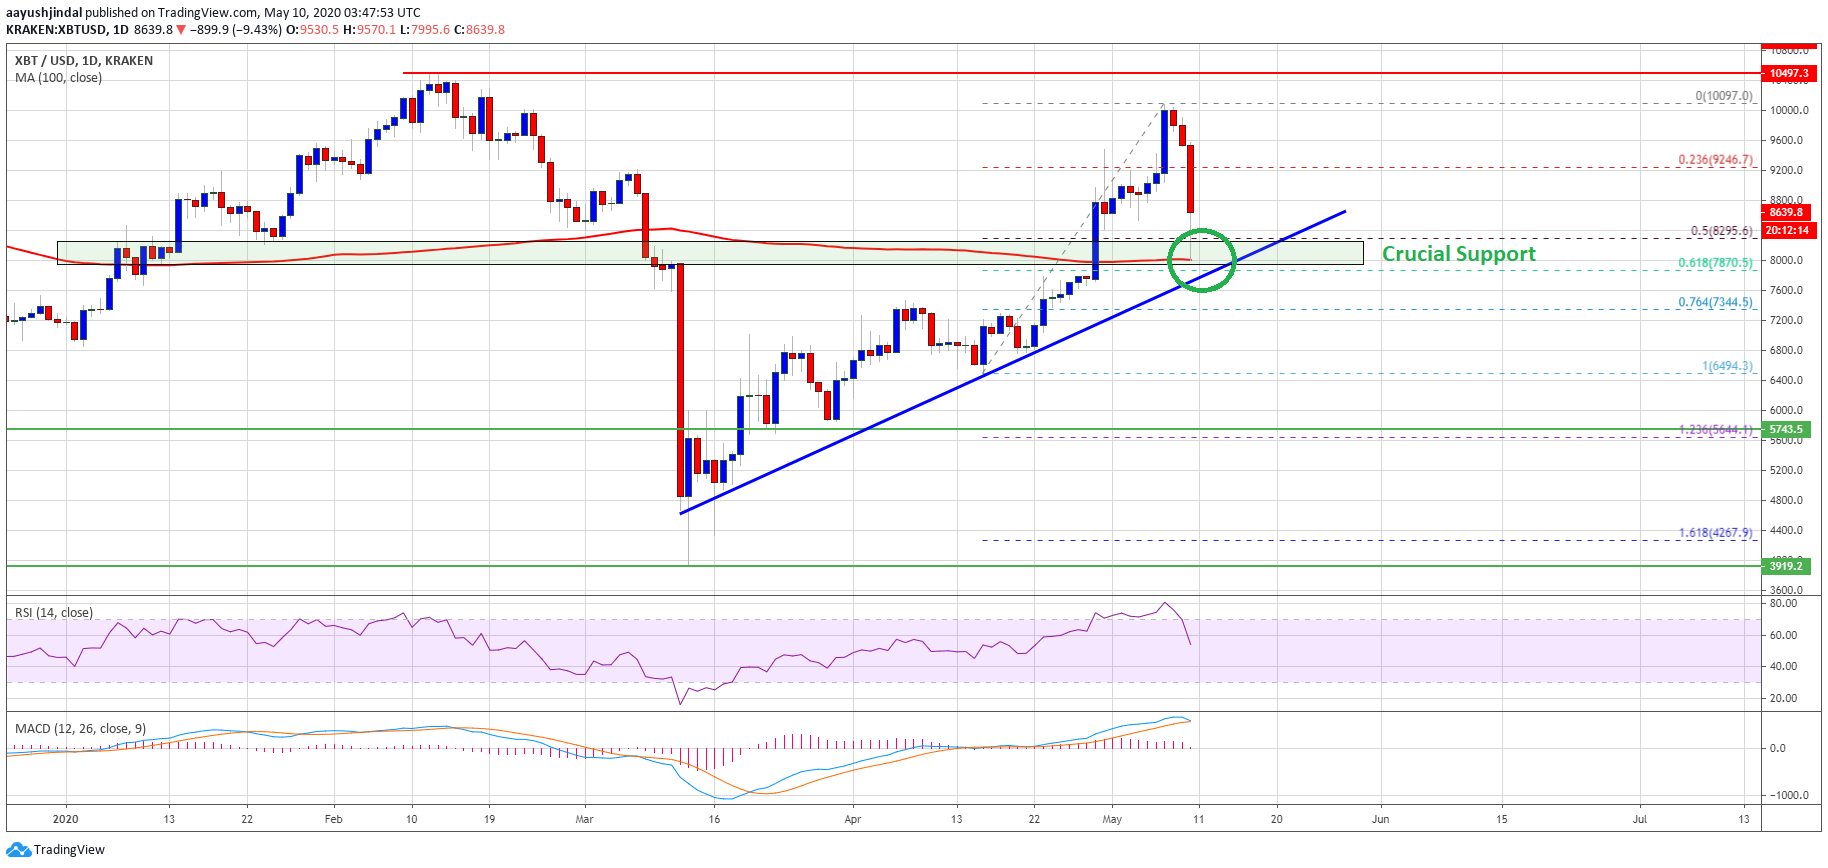
Bitcoin even declined below the $8,500 support, plus the 50% Fib retracement level of the upward move from the $6,494 low to $10,097 high. However, the price found support near the $8,000 zone and the 100-day simple moving average.
The 61.8% Fib retracement level of the upward move from the $6,494 low to $10,097 high is also acting as a support. There is also a major bullish trend line forming with support near $8,000 on the daily chart of the BTC/USD pair.
If the price fails to stay above the trend line support, $8,000, and the 100-day simple moving average, there are chances of a trend change. In the mentioned case, the price could extend its decline towards the $7,350 and $7,000 levels in the coming days.
Dump and Pump
If the 100-day SMA remains intact, bitcoin price is likely to start a fresh increase above the $8,800 and $9,000 resistance levels. The first major resistance is near the $9,200 level, followed by $9,500.
A clear break above the $9,500 resistance may perhaps open the doors for a fresh push towards the $10,000 level in the near term. Any further gains will most likely call for a strong surge towards the $11,000 and $11,200 levels.
Technical indicators:
Daily MACD – The MACD is slowly losing momentum in the bullish zone.
Daily RSI (Relative Strength Index) – The RSI for BTC/USD declined sharply and it is currently approaching the 50 level.
Major Support Levels – $8,200 followed by $8,000.
Major Resistance Levels – $9,000, $9,500 and $10,000.
 Just Passed the Price of Bitcoin at $11,750")
 Price Recovers Above $8.2K But Approach Remains Cautious")
