

Bitcoin price surged above the $40,000 level before correcting lower against the US Dollar. BTC traded below $38,000, but it is likely to find a strong support near $36,500 or $35,200
- Bitcoin extended its rally above the $38,000 and $40,000 resistance levels.
- The price started a downside correction from a new all-time high at $40,400, but it is still well above the 100 hourly simple moving average.
- There was a break below a key bullish trend line with support near $37,500 on the hourly chart of the BTC/USD pair (data feed from Kraken).
- The pair is likely to find a strong buying interest near the $36,500 and $35,200 levels.
Bitcoin Price Rallies To $40K
There was a strong upward move in bitcoin price above the $37,000 resistance level. BTC even broke the $38,000 and $38,500 resistance levels. Finally, there was a spike above the $40,000 level.
The price traded to a new all-time high at $40,400 and settled well above the 100 hourly simple moving average. It started a downside correction and traded below the $38,000 level. There was a break below the 23.6% Fib retracement level of the upward move from the $30,000 swing low to $40,365 swing high.
There was also a break below a key bullish trend line with support near $37,500 on the hourly chart of the BTC/USD pair. The pair is currently consolidating near the $37,000 level.
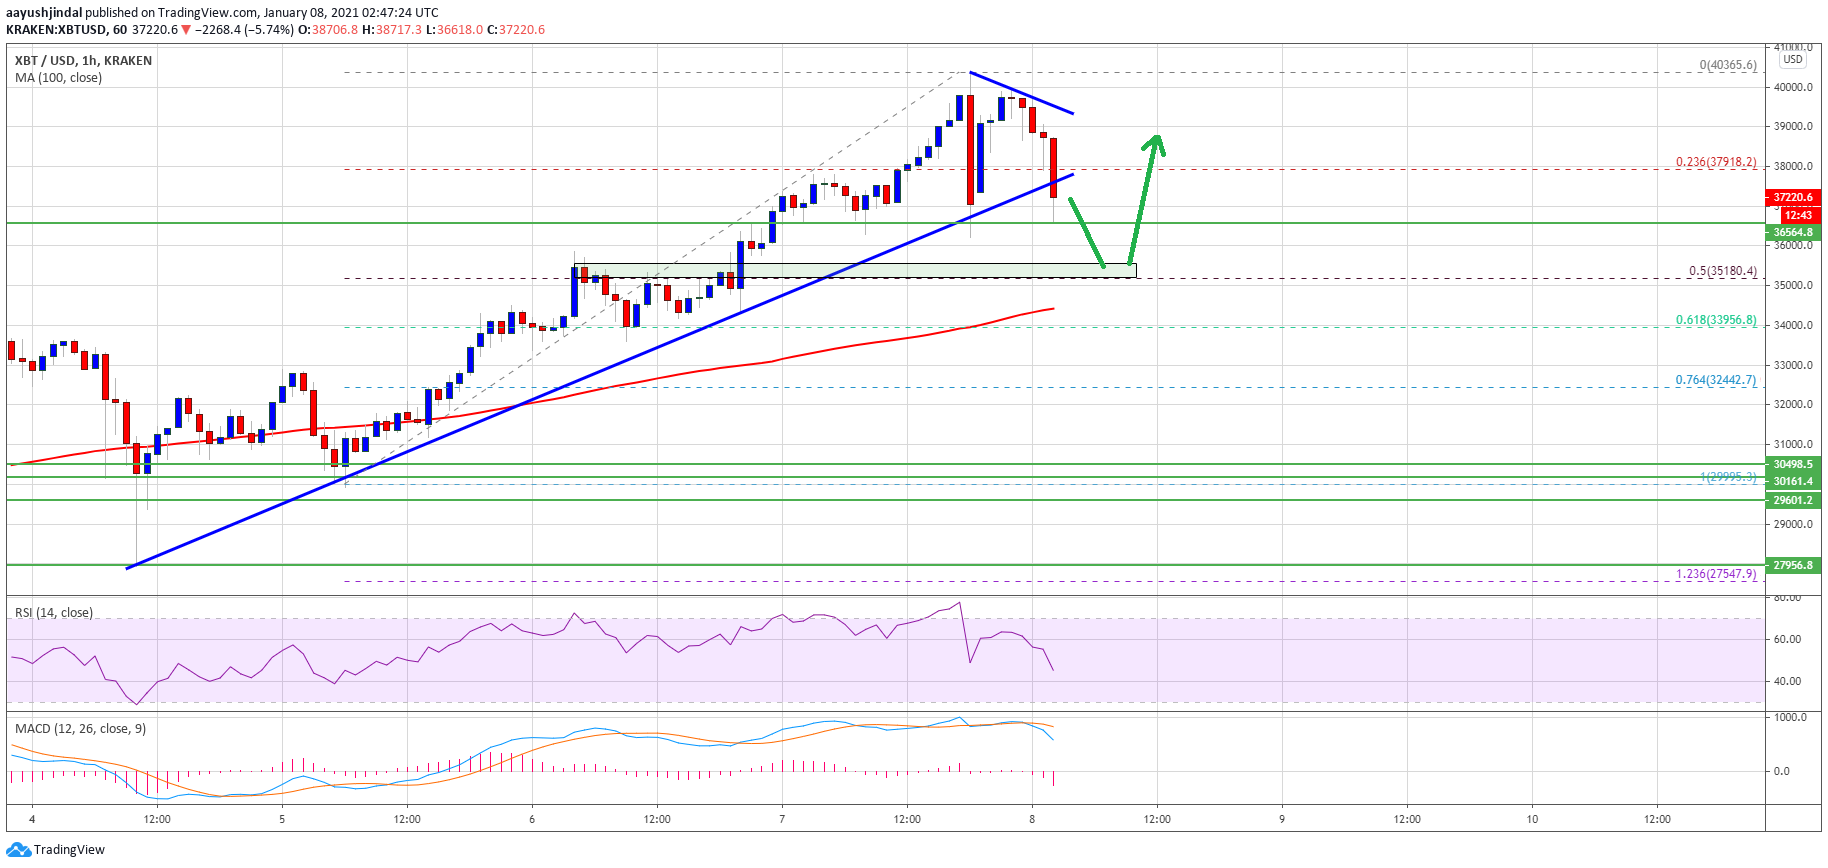
Source: BTCUSD on TradingView.com
The next major support is near the $36,500 level (a multi-touch zone). On the upside, the broken trend line might act as a short-term resistance near $37,500 and $37,800. To start a fresh increase, the price must settle above the $38,000 level. The next key resistance is near $38,880, above which the price could revisit the $40,000 level.
Dips Supported in BTC?
If bitcoin fails to clear the $38,000 and $38,880 levels, it could start another downward move. An initial support on the downside is near the $36,600 and $36,500 levels.
The main support seems to be forming near the $35,200 level. It is close to the 50% Fib retracement level of the upward move from the $30,000 swing low to $40,365 swing high.
Technical indicators:
Hourly MACD – The MACD is gaining momentum in the bearish zone.
Hourly RSI (Relative Strength Index) – The RSI for BTC/USD just dipped below the 50 level.
Major Support Levels – $36,500, followed by $35,200.
Major Resistance Levels – $38,000, $38,880 and $39,800.
 Could Be Next Dominant Cryptocurrency")

