

Bitcoin is gaining bullish momentum above the $9,500 and $9,600 levels against the US Dollar. BTC is likely to continue higher towards $10,000 as long as it is above $9,500.
- Bitcoin is up over 3% and it surpassed the $9,650 resistance zone.
- It traded as high as $9,748 and settled well above the 100 simple moving average (4-hours).
- There is a crucial bullish trend line forming with support near $9,650 on the 4-hours chart of the BTC/USD pair (data feed from Kraken).
- The pair must stay above the $9,650 support level to continue higher towards $10,000.
Bitcoin is Gaining Traction
This past week, Ethereum price surged more than 10% and it dragged bitcoin above $9,500 against the US Dollar. BTC even climbed above the $9,650 resistance and settled well above the 100 simple moving average (4-hours).
The price traded to a new monthly high at $9,748 and it is currently correcting lower. There was a break below the $9,700 level, plus the 23.6% Fib retracement level of the recent upward move from the $9,525 swing low to $9,748 high.
On the downside, there is a strong support forming near the $9,650 level (the recent breakout zone). There is also a crucial bullish trend line forming with support near $9,650 on the 4-hours chart of the BTC/USD pair.
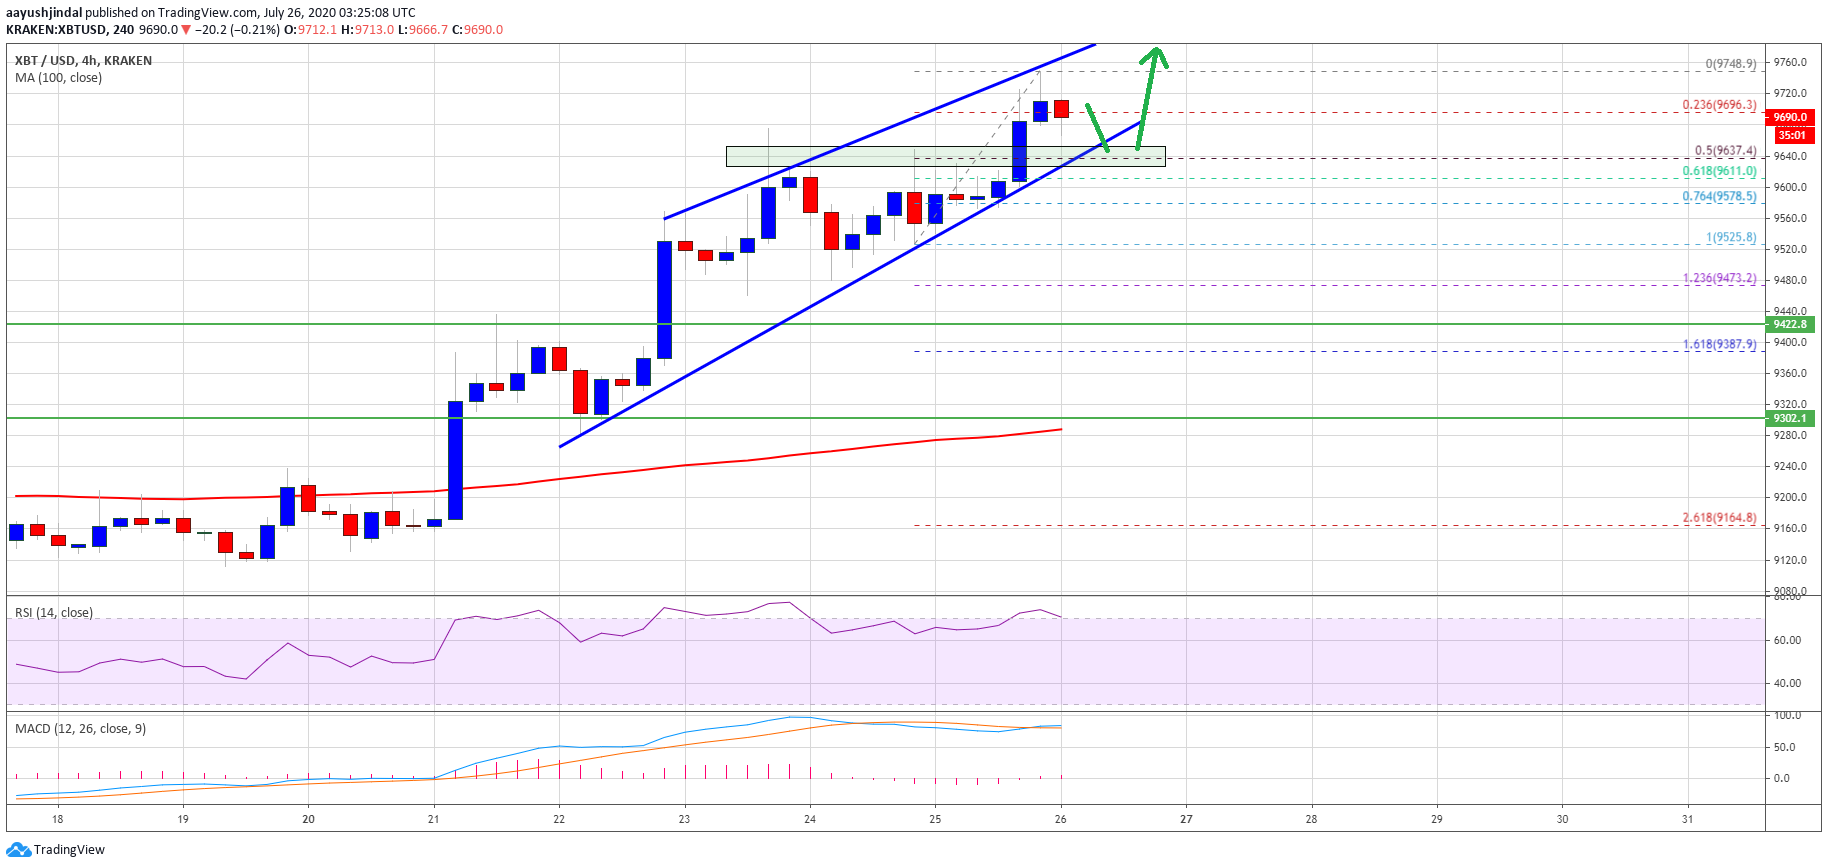
Bitcoin price breaks $9,650. Source: TradingView.com
The trend line is close to the 50% Fib retracement level of the recent upward move from the $9,525 swing low to $9,748 high. On the upside, the price is facing a couple of strong hurdles near the $9,750 level.
If there is a successful break above the $9,750 and $9,800 resistance levels, the price is likely to continue higher. The next major resistance is near the $10,000 and $10,200 levels. Any further gains could lead the price towards the $10,500 level.
Downside Break in BTC?
If bitcoin fails to stay above the main $9,650 support, it could extend its downside correction. The next major support is near the $9,500 pivot level.
A downside break below the $9,500 support level may perhaps spark a strong decline. In the mentioned case, the price might slide towards the $9,300 support zone.
Technical indicators
4 hours MACD – The MACD for BTC/USD is slowly losing momentum in the bullish zone.
4 hours RSI (Relative Strength Index) – The RSI for BTC/USD is currently correcting lower from the 70 level.
Major Support Level – $9,650
Major Resistance Level – $9,750
Take advantage of the trading opportunities with Plus500
Risk disclaimer: 76.4% of retail CFD accounts lose money.


