

- Bitcoin price is down 6% and tested $7,400 (discussed in the medium term outlook) against the US Dollar.
- The price is showing no signs of a strong recovery and remains at a risk below $7,800.
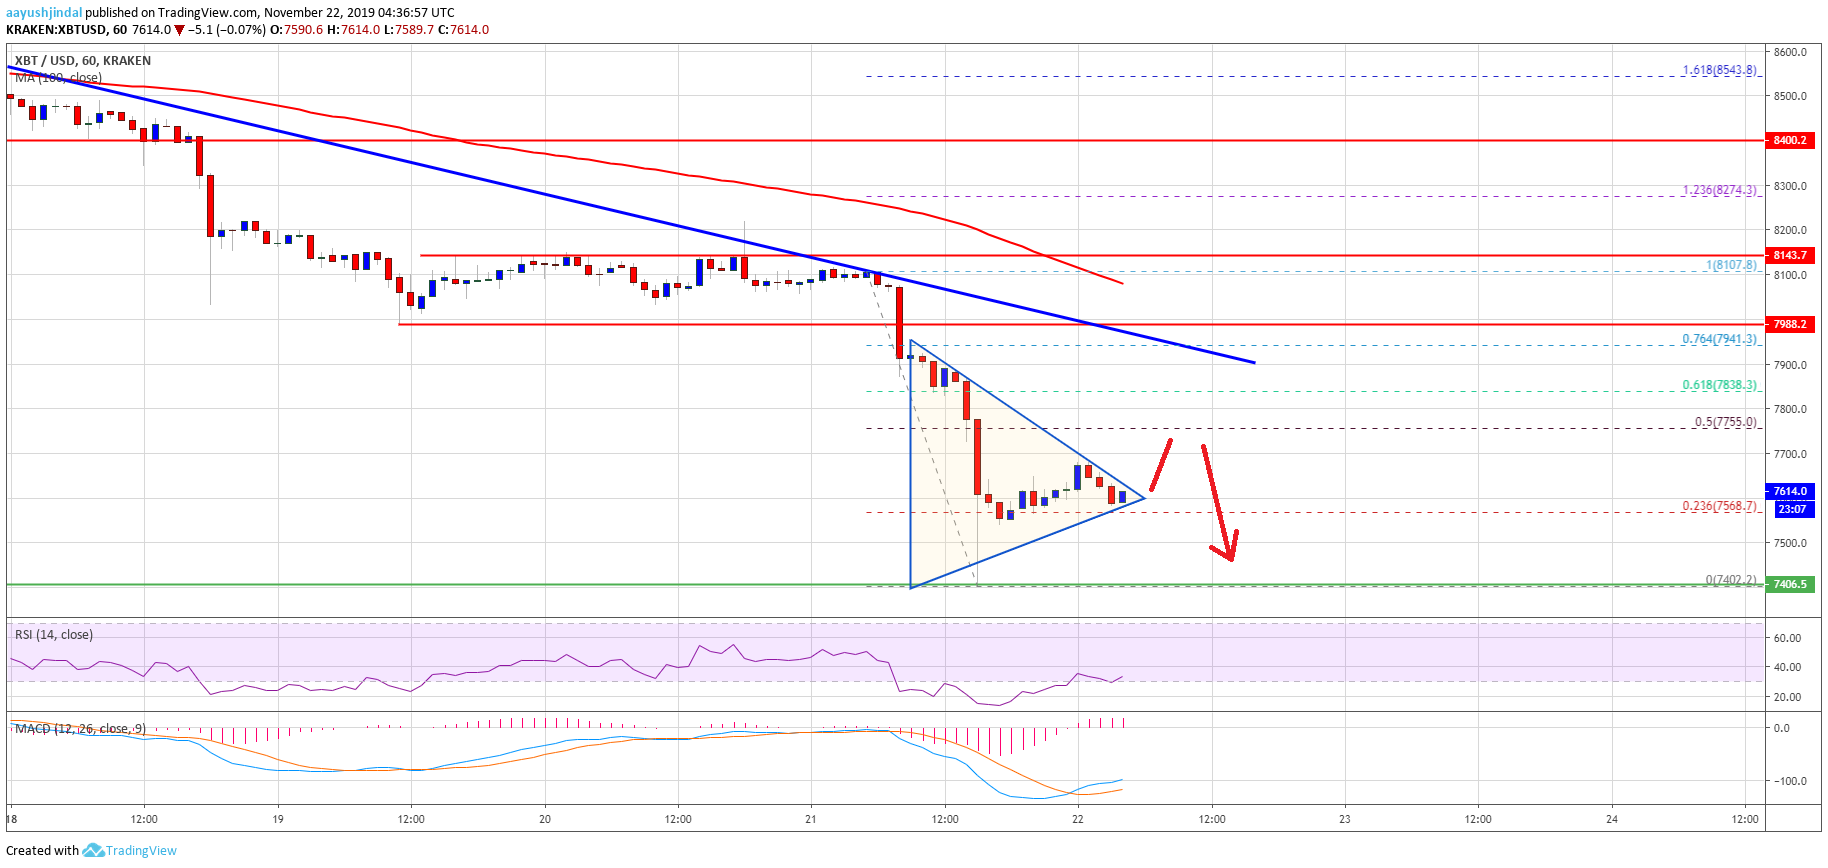
- There is a key contracting triangle forming with resistance near $7,650 on the hourly chart of the BTC/USD pair (data feed from Kraken).
- A daily close below $7,400 could open the doors for a push towards $6,500 (as discussed in the recent medium term outlook).
Bitcoin price is declining heavily below $7,800 and $7,600 against the US Dollar. The $7,400 support holds the key, below which BTC could eye a test of $6,500.
Bitcoin Price Analysis
In the recent medium term outlook, I discussed the chances of bitcoin declining further below $8,000 against the US Dollar. The first major bearish target was $7,400 and BTC price did test the same in the recent decline.
After struggling to recover above the $8,000 level and the 100 hourly simple moving average, there was a sharp decline. The price is down around 6% and it broke many supports near $7,800 and $7,600.
Finally, the price tested the first major bearish target was $7,400 and a new monthly low was formed near $7,402. The price is currently correcting above the $7,500 level. Moreover, it traded above the 23.6% Fib retracement level of the recent drop from the $8,107 high to $7,402 low.
However, the price is struggling to gain strength above $7,640. Additionally, there is a key contracting triangle forming with resistance near $7,650 on the hourly chart of the BTC/USD pair.
If there is an upside break above $7,640 and $7,650, bitcoin price may perhaps test the next resistance near $7,755. It represents the 50% Fib retracement level of the recent drop from the $8,107 high to $7,402 low.
The next major resistance is near the $7,825 level and a connecting bearish trend line on the same chart. Therefore, the price must climb above the $7,825 and $8,000 levels to move into a positive zone.
Conversely, there could be another breakdown below $7,500 and $7,400. Should there be a daily close below $7,400, the price is likely to accelerate further lower. An initial support is near the $7,200 level. Having said that, the price could even aim the $6,500 support area (the next major bearish target).
Looking at the chart, bitcoin price is trading near a major support at $7,400. Thus, there are chances of a decent recovery above $7,800. On the other hand, the price could aim a larger bearish wave below $7,400.
Technical indicators:
Hourly MACD – The MACD is slowly moving in the bullish zone.
Hourly RSI (Relative Strength Index) – The RSI for BTC/USD is currently recovering and is above the 30 level.
Major Support Levels – $7,500 followed by $7,400.
Major Resistance Levels – $7,640, $7,825 and $8,000.


