

- Bitcoin price started an upside correction from the $8,674 swing low against the US Dollar.
- The price is up around 3%, but it is facing hurdles near the $9,100 and $9,150 levels.
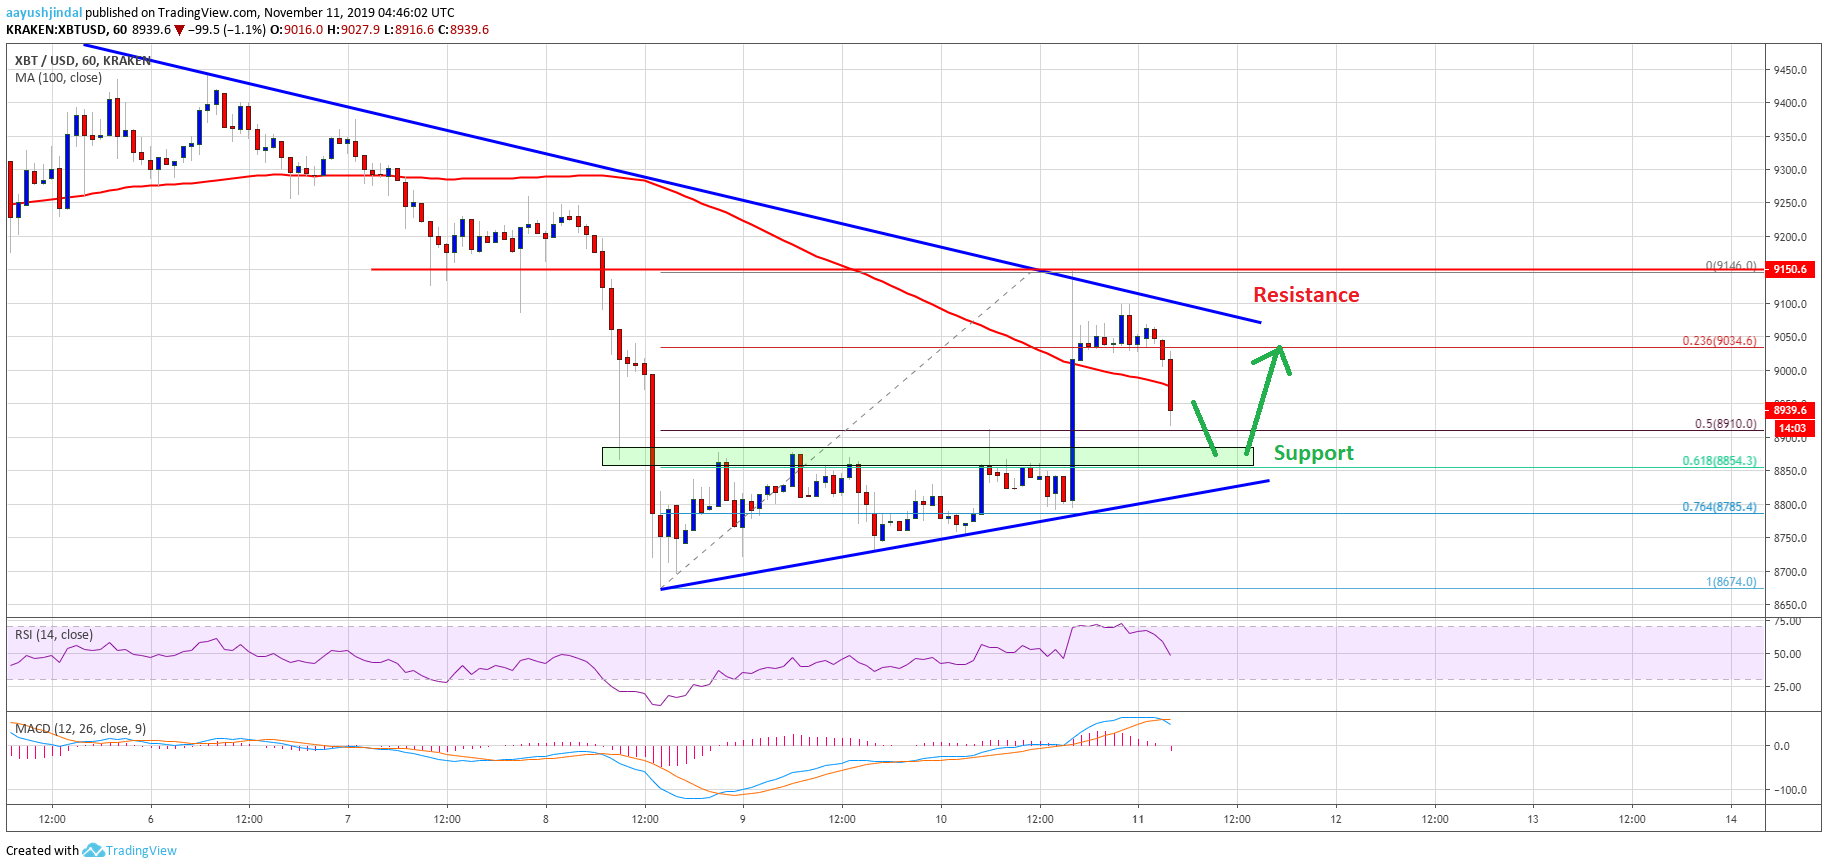
- There is a key bearish trend line forming with resistance near $9,100 on the hourly chart of the BTC/USD pair (data feed from Kraken).
- On the downside, there is a decent support forming near the $8,860 levels.
Bitcoin price is currently correcting higher above $8,800 against the US Dollar. However, BTC is still facing a couple of key hurdles near $9,100 and $9,150.
Bitcoin Price Analysis
After a major decline, bitcoin found support near the $8,670 level against the US Dollar. A new monthly low was formed near $8,674 before the price started an upside correction.
The price recovered above the $8,800 and $8,900 levels. Moreover, there was a break above the $9,000 resistance area and the 100 hourly simple moving average. The bulls were able to gain strength, but they faced a strong selling interest near the $9,150 and $9,160 levels.
A high was formed near $9,146 and the price is currently retreating from the high. It broke the $9,000 support area and the 100 hourly SMA. Additionally, there was a break below the 23.6% Fib retracement level of the recent wave from the $8,674 low to $9,146 high.
An immediate support on the downside is near the $8,900 level. It represents the 50% Fib retracement level of the recent wave from the $8,674 low to $9,146 high. The main support is near the $8,860 and $8,840 levels.
More importantly, there is a connecting bullish trend line forming with support near $8,840 on the hourly chart of the BTC/USD pair. Finally, the 61.8% Fib retracement level of the recent wave from the $8,674 low to $9,146 high is near $8,854.
Therefore, a downside break below the $8,840 level might restart the decline in bitcoin. The next key support is near the $8,700 area, below which the price could revisit the $8,500 level.
On the upside, the price is facing hurdles near the $9,100 and $9,150 levels. Besides, there is a key bearish trend line forming with resistance near $9,100 on the same chart.
Looking at the chart, bitcoin seems to be struggling to continue above $9,100. If it continues to struggle, there is a risk of another bearish wave below the $8,800 level in the near term.
Technical indicators:
Hourly MACD – The MACD is currently moving back into the bearish zone.
Hourly RSI (Relative Strength Index) – The RSI for BTC/USD is currently declining and approaching the 50 level.
Major Support Levels – $8,900 followed by $8,840.
Major Resistance Levels – $9,100, $9,150 and $9,300.


 Early Preview of the New DApp is Well Received by Investors! Uniswap (UNI) and Bitcoin (BTC) Hold Steady!")