

- Bitcoin price is currently correcting lower and is trading below $9,500 against the US Dollar.
- The price is likely to decline further towards $8,700 before it could rise again.
- Yesterday’s highlighted key bearish trend line is intact with resistance near $9,460 on the hourly chart of the BTC/USD pair (data feed from Kraken).
- The price must surpass the $9,460 and $9,500 resistance levels to start a fresh increase.
Bitcoin price is facing a few key hurdles near $9,500 against the US Dollar. Therefore, BTC could dip a few points before a fresh increase in the near term.
Bitcoin Price Analysis
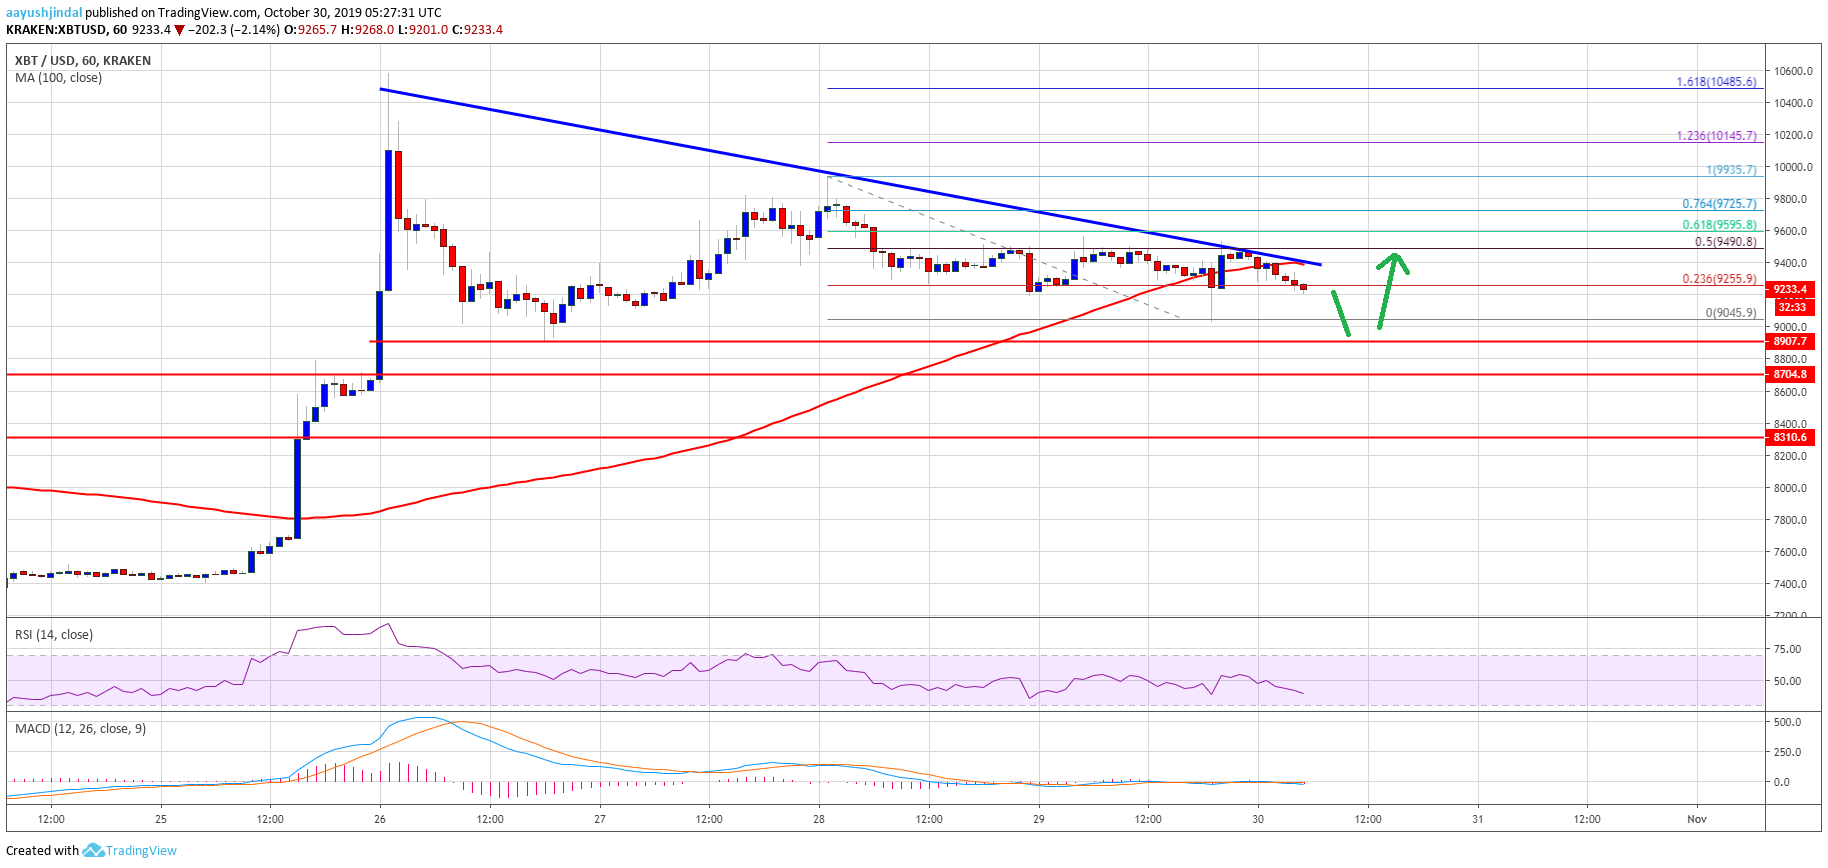
Recently, there was an extended downside correction in bitcoin below the $9,200 support area against the US Dollar. BTC even traded below the $9,100 level and formed a new weekly low near $9,045.
The price recovered from $9,045 and traded above the $9,200 resistance. Moreover, there was a break above the 23.6% Fib retracement level of the recent decline from the $9,935 high to $9,045 low.
Bitcoin even climbed above the $9,400 level and the 100 hourly simple moving average. However, the upward move was capped by the $9,500 resistance area. Besides, the 50% Fib retracement level of the recent decline from the $9,935 high to $9,045 low acted as a resistance.
More importantly, yesterday’s highlighted key bearish trend line is intact with resistance near $9,460 on the hourly chart of the BTC/USD pair. The 100 hourly SMA is also near the trend line and $9,500.
Therefore, a clear break above the trend line and the 100 hourly SMA could open the doors for a fresh increase above the $9,500 resistance. The next key resistances are near the $9,725 and $9,880 levels.
On the downside, there are many supports near the $9,040 and $9,000 levels. It seems like the price could spike below the $9,000 support area and test $8,800 or $8,700. Once the current wave completes near the $8,800 or $8,700 support, the price is likely to bounce back in the coming sessions.
Looking at the chart, bitcoin is clearly facing a lot of hurdles near the $9,460 and $9,500 levels. Unless there is a close above $9,500, there is a risk of an extended drop towards the $9,000 and $8,800 support levels in the near term. Conversely, a successful close above $9,500 is likely to start a fresh bullish wave towards the $9,800 and $9,950 levels.
Technical indicators:
Hourly MACD – The MACD is gaining pace in the bearish zone.
Hourly RSI (Relative Strength Index) – The RSI for BTC/USD is moving lower and it is currently below the 50 level.
Major Support Levels – $9,000 followed by $8,800.
Major Resistance Levels – $9,460, $9,500 and $9,720.


