

Bitcoin is currently consolidating above the $8,500 and $8,250 support levels against the US Dollar. BTC price seems to be setting up for a strong bull run above $9,000 and $9,100.
- Bitcoin is trading in a crucial range above the $8,500 and $8,200 support levels.
- The bulls need to clear the $9,000 and $9,100 hurdles to gain strength.
- There was a break above a connecting bearish trend line with resistance near $8,920 on the hourly chart of the BTC/USD pair (data feed from Kraken).
- The pair must settle above $9,100 to start a fresh bull run in the near term.
Bitcoin Could Surge Above $9,100
In the past few sessions, bitcoin price remained well bid above the $8,500 and $8,250 support levels against the US Dollar. BTC price traded as low as $8,203 and recently started a steady recovery wave.
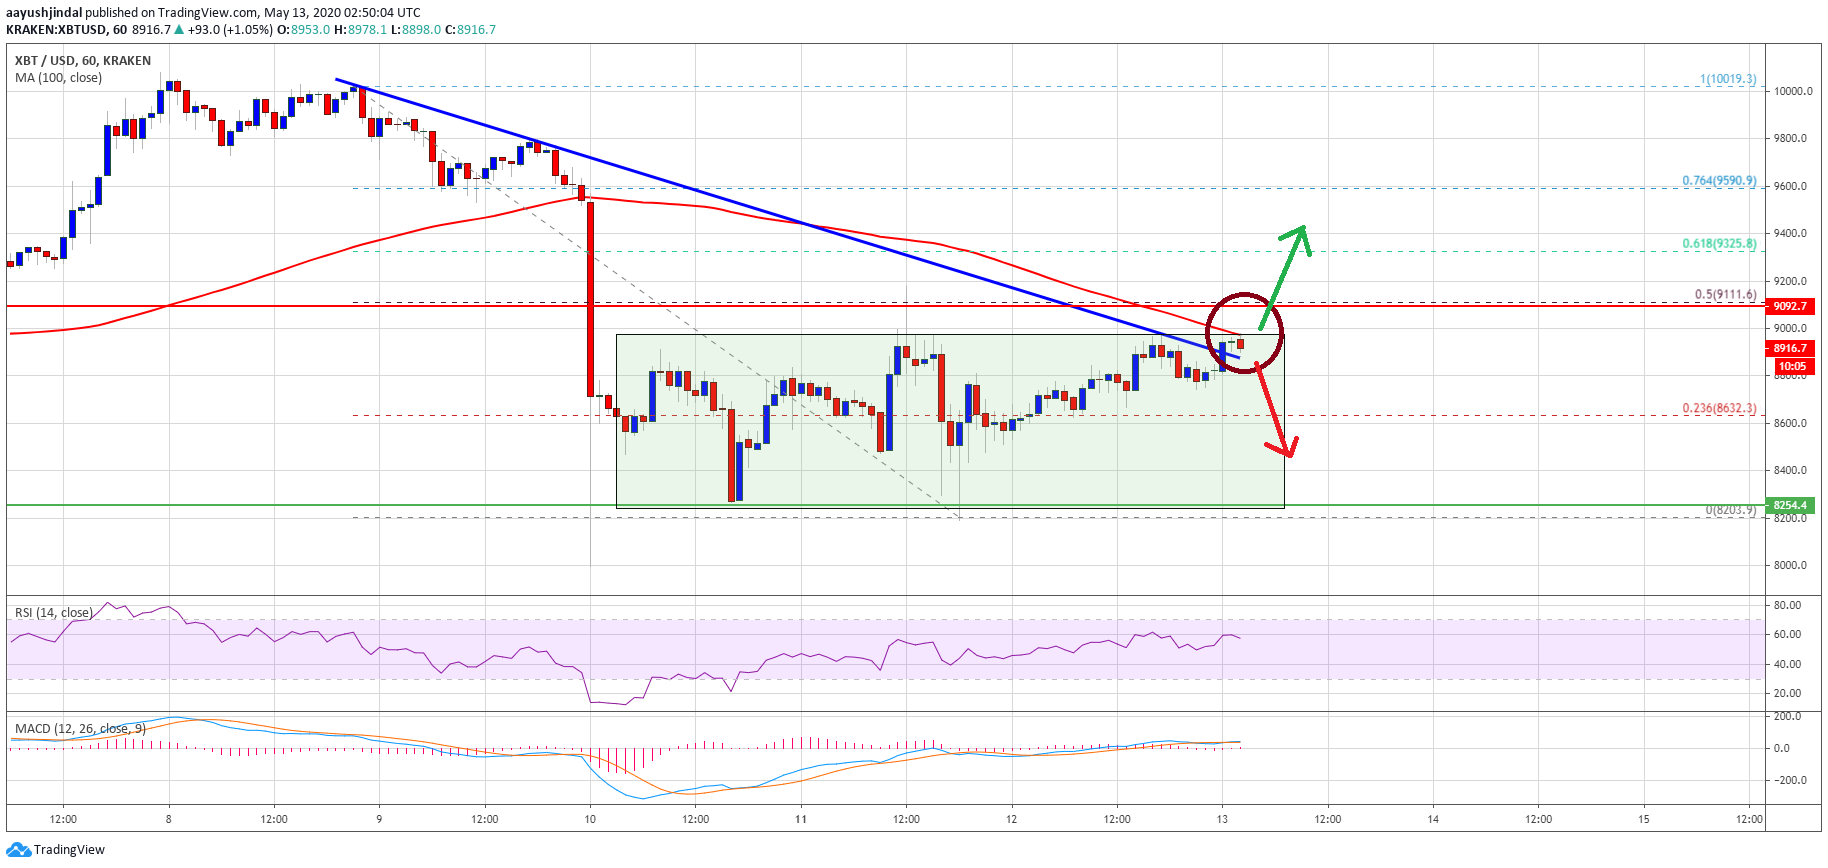
It surpassed the $8,500 and $8,600 resistance levels. Besides, there was a break above the 23.6% Fib retracement level of the main drop from the $10,020 high to $8,203 low.
The upward move was such that there was a break above a connecting bearish trend line with resistance near $8,920 on the hourly chart of the BTC/USD pair. Bitcoin is now trading above $8,900 and testing the 100 hourly simple moving average.
An immediate resistance above the 100 hourly simple moving average is near the $9,100 level. It is close to the 50% Fib retracement level of the main drop from the $10,020 high to $8,203 low.
If BTC breaks the 100 hourly SMA and clears the $9,100 resistance, there could be a strong increase towards the $9,500 level. Any further gains could lead the price towards the $9,800 and $10,000 resistance levels. An intermediate resistance might be near the $9,880 level.
Bearish Reaction
If bitcoin fails to clear the 100 hourly SMA or the $9,100 resistance, it could react to the downside. An initial support is near the $8,800 level.
The first major support is seen near the $8,500 level, below which the bears are likely to aim a test of the lower end of the range at $8,250. Any further losses below $8,250 or $8,200 could open the doors for a sharp decline below $8,000 and $7,800 in the near term.
Technical indicators:
Hourly MACD – The MACD is slowly gaining momentum in the bullish zone.
Hourly RSI (Relative Strength Index) – The RSI for BTC/USD is now well above the 50 level.
Major Support Levels – $8,800 followed by $8,500.
Major Resistance Levels – $9,000, $9,100 and $9,175.
Featured image from unsplash.


