

Binance coin price is up over 35% and it is extended its rally above $200 against the USDT. BNB traded to a record high at $238 and it seems like there are chances of more upsides.
- Binance coin price extended its rally above the $175 and $200 resistance levels against the USDT.
- The price traded to a new all-time high at $238 and it settled well above the 100 simple moving average (4-hours).
- There was a break above a couple of bullish continuation patterns at $170 and $200 on the 4-hours chart of the BNB/USDT pair (data source from Binance).
- There is consolidating gains and it is likely to continue higher towards $250 and $275.
Binance Coin Price Rallies 35%
In the past few days, binance coin gained a strong bullish momentum above the $100 level. BNB price outperformed bitcoin and Ethereum, with massive gains.
It even broke the $150 and $175 resistance levels. During the recent rally, there was a break above a couple of bullish continuation patterns at $170 and $200 on the 4-hours chart of the BNB/USDT pair. The pair even surged above the $200 and $210 levels.
It traded to a new all-time high at $238 and it settled well above the 100 simple moving average (4-hours). BNB is currently correcting gains and testing the $225 level.
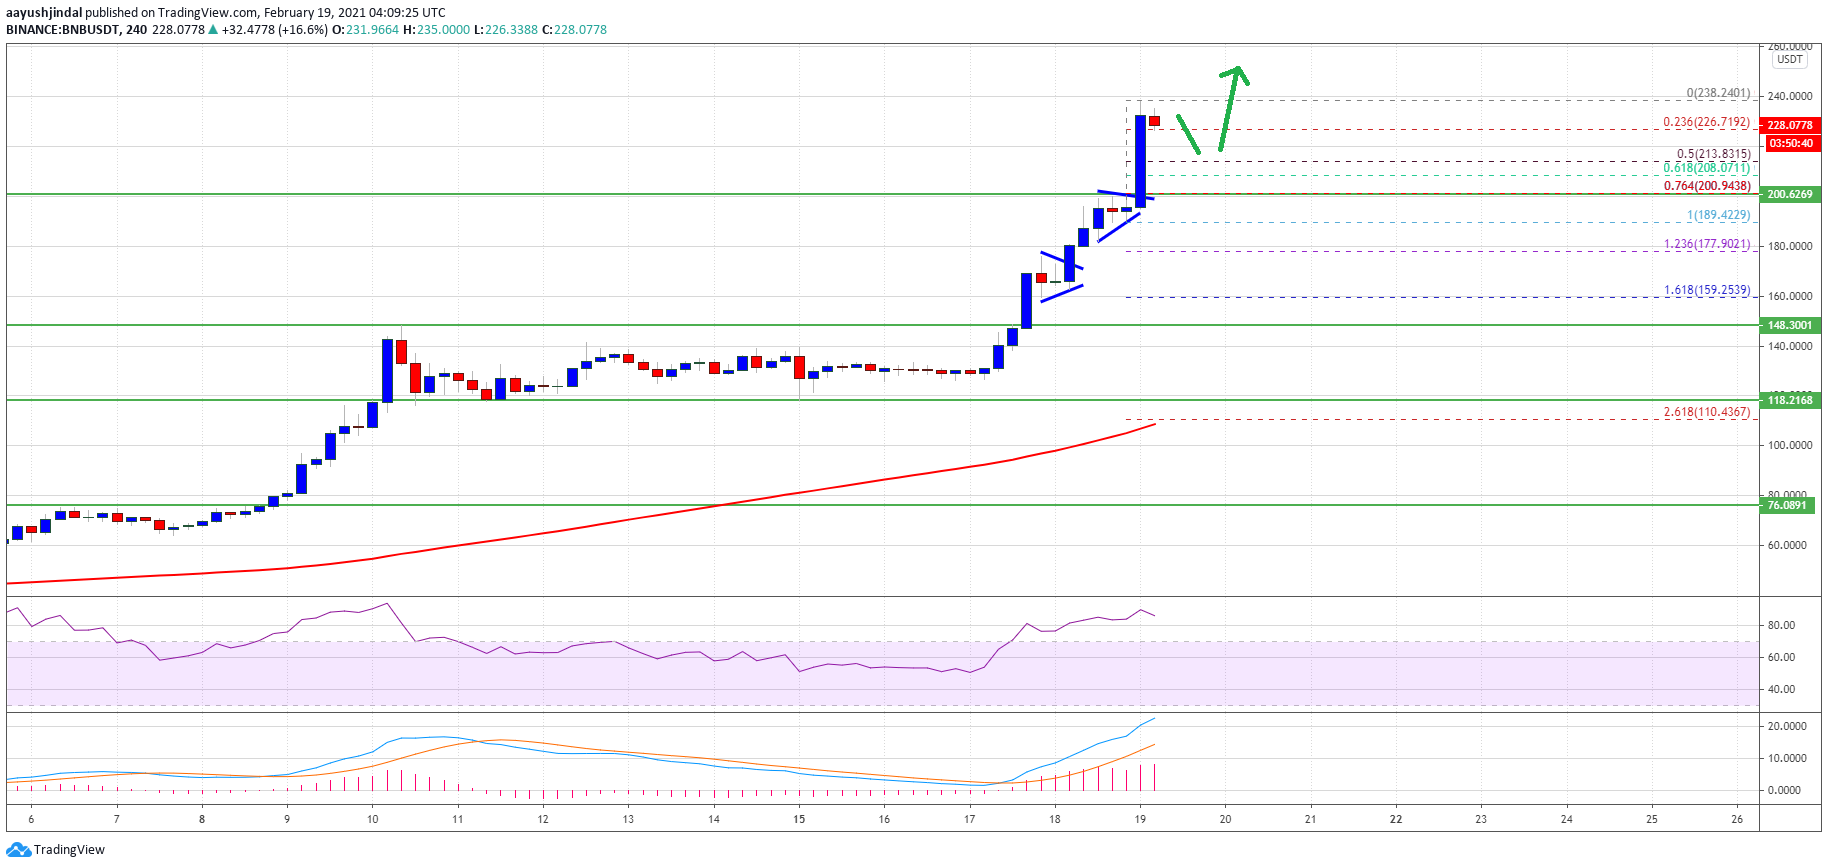
Source: BNBUSDT on TradingView.com
The 23.6% Fib retracement level of the recent rally from the $189 swing low to $238 high is acting as a strong support. If there are any more losses, the price could decline towards the $210 level.
On the upside, the $240 level is a short-term hurdle. The next major resistance is near the $250 level. A clear break above the $250 level will most likely open the doors for a sharp increase towards the $285 and $300 levels in the near term.
Dips Supported in BNB?
If BNB fails to continue higher above $240 and $250, there could be a downside correction. The first major support is near the $225 level.
The next major support is near the $210 level. It is close to the 50% Fib retracement level of the recent rally from the $189 swing low to $238 high. Any more losses might call for a test of $200.
Technical Indicators
4-Hours MACD – The MACD for BNB/USDT is gaining momentum in the bullish zone.
4-Hours RSI (Relative Strength Index) – The RSI for BNB/USDT is currently in the overbought zone.
Major Support Levels – $225, $210 and $200.
Major Resistance Levels – $240, $250 and $300.


