

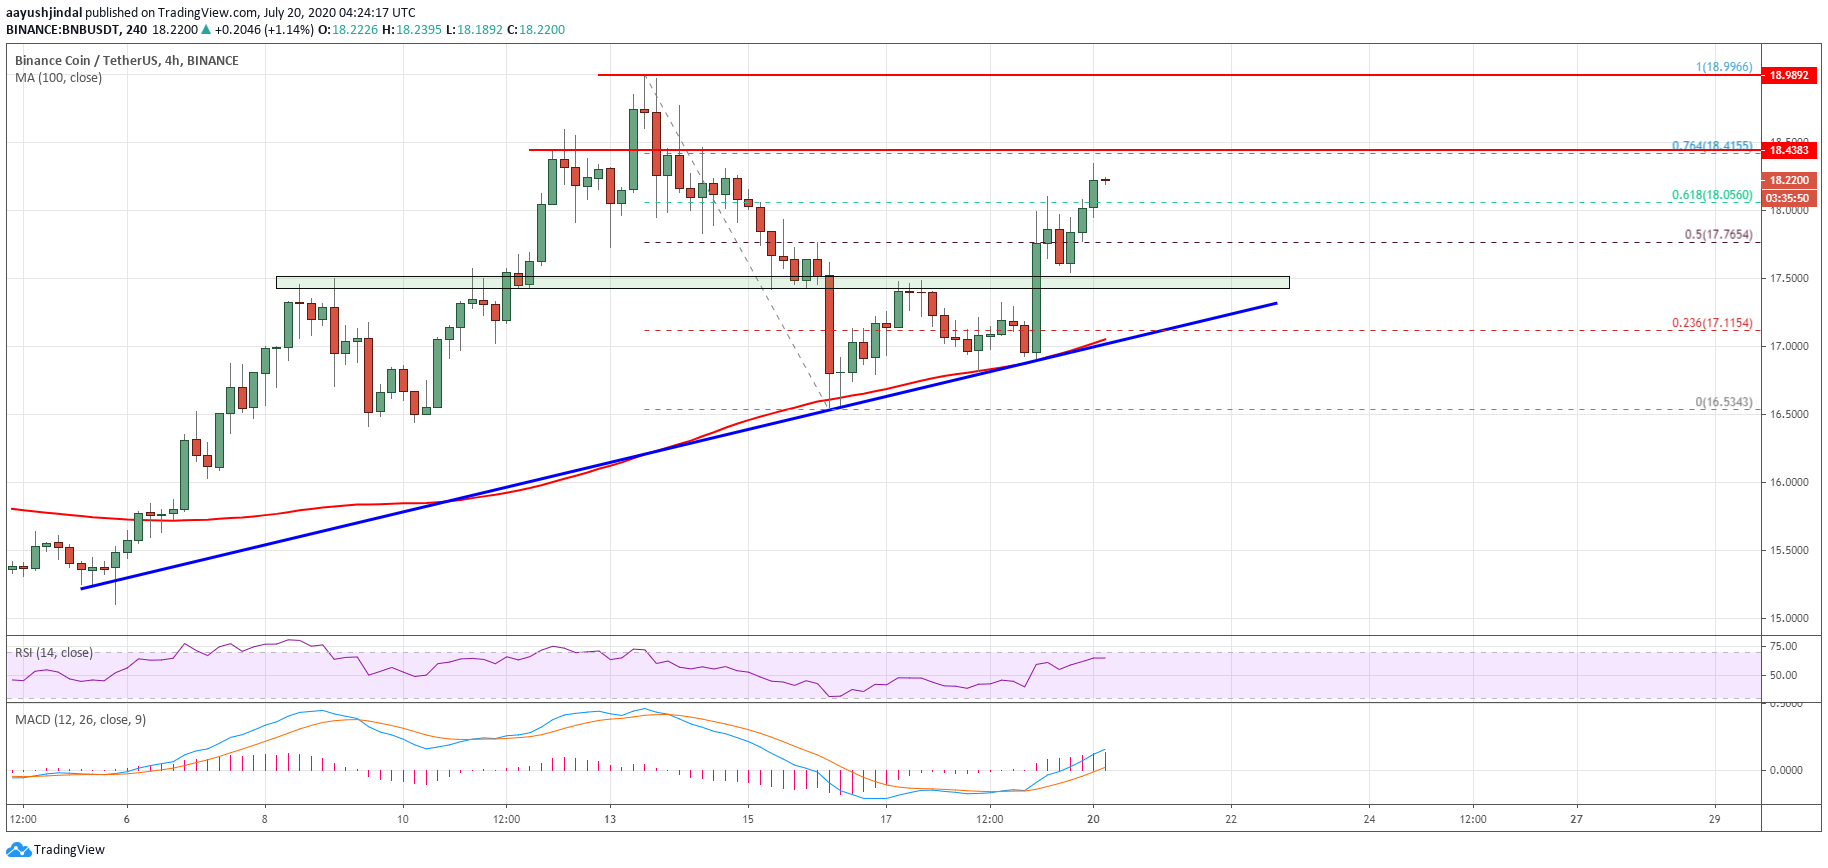
Binance coin price is gaining bullish momentum above the $18.00 resistance against the USDT. BNB is trading in a nice uptrend and it could aim a break above the $18.99 monthly high.
- Binance coin price is up more than 7% and it recently broke the $18.00 resistance against the USDT.
- The price is likely to continue higher above the $18.50 and $19.00 resistance levels.
- There is a crucial bullish trend line forming with support near $17.30 on the 4-hours chart of the BNB/USDT pair (data source from Binance).
- Bitcoin could follow BNB and it might gain traction if there is a proper close above $9,200.
Binance Coin Price Gaining Momentum
This past week, binance coin declined below the $17.50 support level. BNB price even broke the $17.00 support level, but it found a strong support near the 100 simple moving average (4-hours).
A low was formed near $16.53 and the price recently started a positive upward move. It broke the $17.50 resistance zone to move into a bullish zone. More importantly, there was a break above the 61.8% Fib retracement level of the last key decline from the $18.99 high to $16.53 low.
It seems like there is a crucial bullish trend line forming with support near $17.30 on the 4-hours chart of the BNB/USDT pair. The pair is up more than 7% and it recently broke the $18.00 resistance.
Binance coin price trades above $18.00. Source: TradingView.com
An immediate resistance is near the $18.40 level. It is close to the 76.4% Fib retracement level of the last key decline from the $18.99 high to $16.53 low. A clear break above the $18.40 and $18.50 resistance levels could open the doors for a larger rally.
The next resistance is near the $19.00 level, above which BNB might continue to rise towards the $19.80 and $20.00 resistance levels in the near term
Dips Supported in BNB
If BNB fails to clear the $18.40 and $18.50 resistance levels, it could start a downside correction. An initial support is seen near the $17.50 level (a multi-touch zone).
The main support is near the trend line, $17.20, and the 100 SMA. A close below $17.20 and $17.00 might push the price into a bearish zone.
Technical Indicators
4-Hours MACD – The MACD for BNB/USDT is gaining momentum in the bullish zone.
4-Hours RSI (Relative Strength Index) – The RSI for BNB/USDT is currently well above the 55 level.
Major Support Levels – $17.50, $17.20 and $17.00.
Major Resistance Levels – $18.40, $18.50 and $19.00.
Take advantage of the trading opportunities with Plus500
Risk disclaimer: 76.4% of retail CFD accounts lose money.


 and Dogecoin (DOGE)")