

The price of Avalanche (AVAX) slips at $30 against Tether (USDT) as Avalanche (AVAX) eyes key support to hold the price from selling off. AVAX showed great strength rallying to a high of $30 but was rejected as Bitcoin’s (BTC) price continued to go lower, affecting the price of AVAX from trending higher. (Data from Binance)
Avalanche (AVAX) Price Analysis On The Weekly Chart
According to the chart, the price of AVAX had a strong bullish bias at $30, but the price was rejected from that region, causing the price of AVAX to move downward.
After hitting a weekly low of $14.5, AVAX rallied to a high of $30, with hopes of retesting $50. The price was rejected at $30 and has since remained bullish.
The price of AVAX closed with a weekly bearish candle, and the price volume suggests that the new week will be even more bearish.
If AVAX maintains its current structure, we could see a retest of the support at $14.5 or lower, depending on sell volume.
Weekly resistance for the price of AVAX – $30.
Weekly support for the price of AVAX – $14.5.
Price Analysis Of AVAX On The Daily (1D) Chart
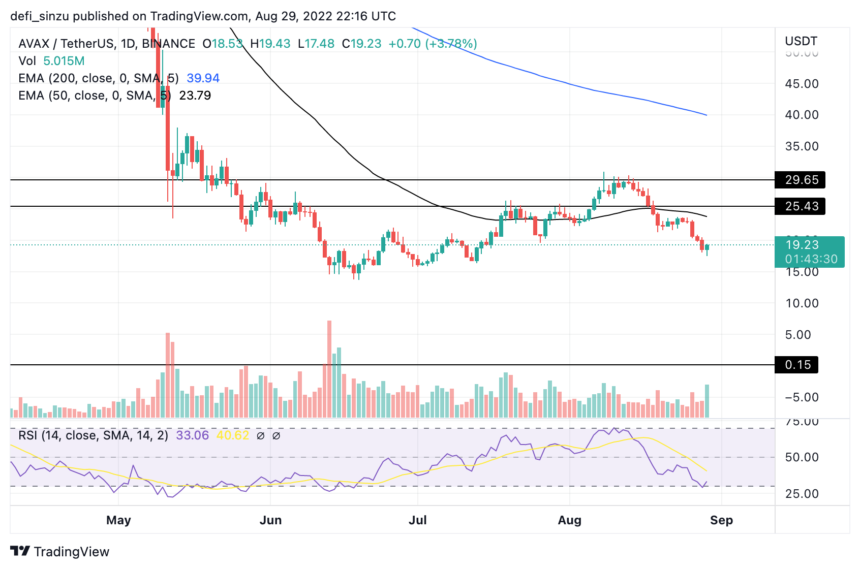
AVAX’s price reached a daily low of $16, forming good support for the price to bounce off. AVAX’s price rose to $30, but it couldn’t break through the resistance because the price was sharply rejected.
AVAX is currently trading at $19.3 below the 50 and 200 Exponential Moving Averages (EMA), which act as resistance to the price of AVAX breaking higher.
The 50 and 200 EMA correspond to prices of $24 and $40, respectively; for AVAX to trend higher, it must break through this region, which acts as resistance for AVAX prices.
A break and close above the 50-day moving average would indicate a short-term relief bounce, while a close above the 200-day moving average would indicate a downtrend reversal to the upside of the current bearish trend.
If the price of AVAX fails to break the resistance at $24, we could see the price of AVAX going to the lower region for price accumulation at $16.
Daily (1D) resistance for AVAX price – $24.
Daily (1D) support for AVAX price – $16.
Price Analysis Of AVAX On The Four-Hourly (4H) Chart
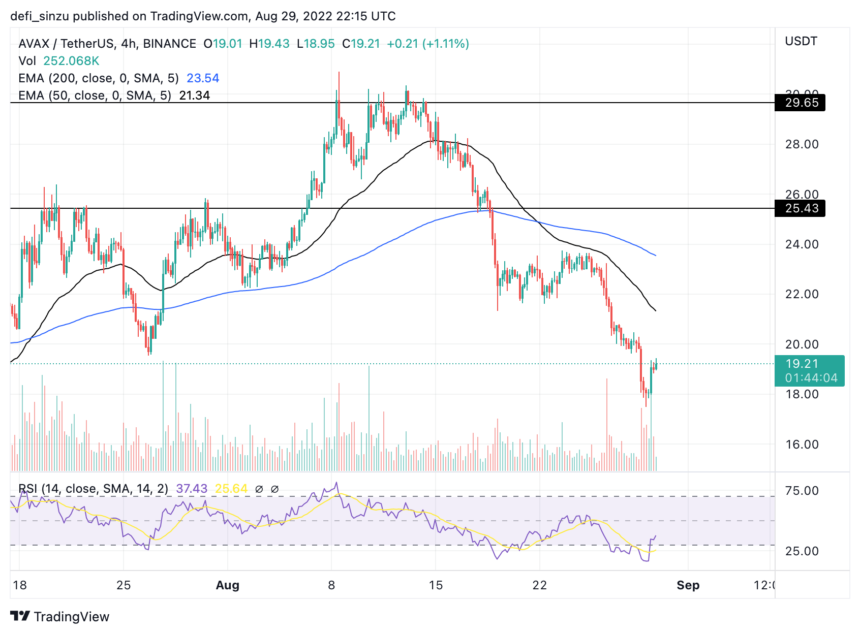
The price of AVAX on the 4H chart has continued to look weak, trying to hold above the support area at $18; more buy orders in this region could see the price of AVAX going higher.
AVAX has formed a bullish divergence on the 4H chart as the price is oversold; we could see a bounce from this region for AVAX price, as $24 could act as minor resistance.
The Relative Strength Index (RSI) for AVAX on the 4H chart is below 30, indicating AVAX is oversold.
Four-Hourly (4H) resistance for AVAX price – $24.
Four-Hourly (4H) support for AVAX price – $18.
Featured Image From Fintechs, Charts From TradingView.com


