

At Last, the Bitcoin Price Hits $10K Again! But Can It Hold?
October 28, 2019 by Jon Southurst
Some good news at last: the bitcoin price has returned to its $10,000 USD axis lateral market, but volatility is increasing at the same time. Removing all emotion from the process and looking at the charts, read our weekly technical analysis to see what the data says could happen in the coming months.
Also read: Despite Bitcoin Price Blues, Hope of $10K Springs Eternal
Bitcoin Price Technical Analysis
Long-Term Analysis
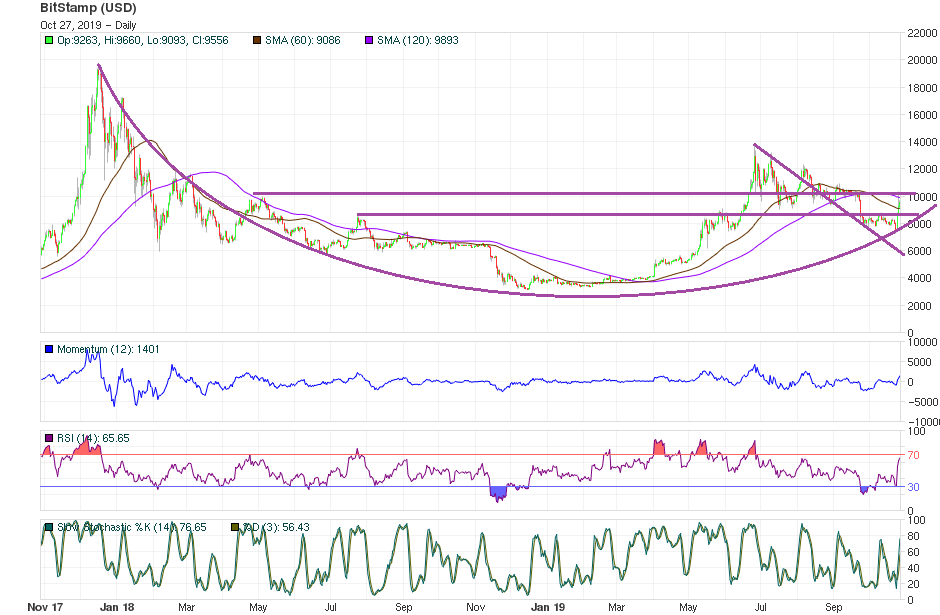
After the trend matched a long term rounded bottom curve which is still active,the bitcoin price performed a moderate reversion back to its former $10,000 axis. Fibonacci Retracement Numbers Theory also points to the current level as a theoretical scenario where the market would balance, even if a bearish pull-back drives it back to the aforementioned curve.
According to Mass Psychology Analysis, the Hope phase should consolidate if and when quotes stay over $9,000.
Mid-Term Analysis
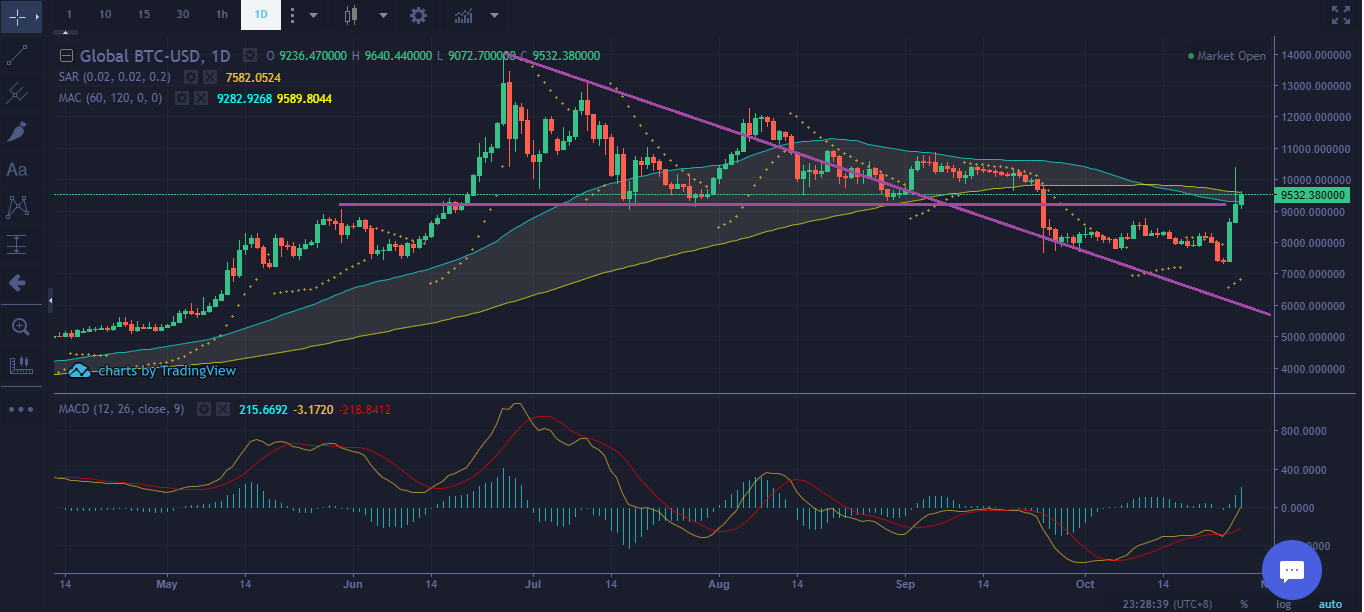
The trendline re-framed into Fibonacci Retracement theory, and the active sideways movement settled the volatility range within 3,000 points from $9,000 to $12,000.
Due the lateral market, values are out of their last bearish channel influence. Backed by mathematical indicators, they may be able to start an upward march to face $12,000 if and when they balance for two weeks at the current level.
Short-Term Analysis
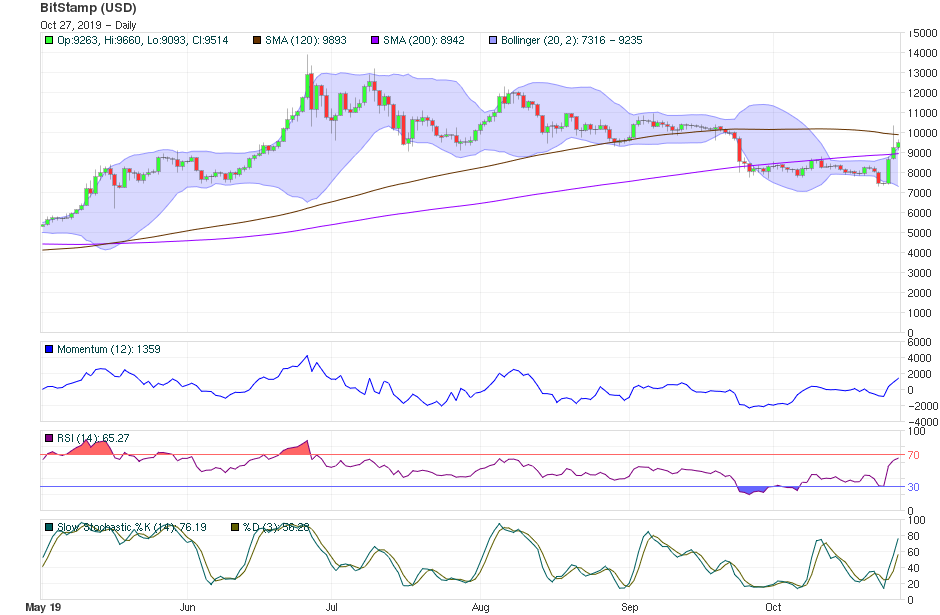
Japanese Candlestick’s Demand soldiers defeated Offer’s crows and are re-entering the former battlefield between $9,000 and $12,000. Mathematical indicators turned to the up side to back the quotes’ rise, keeping the trend into a bullish frame, even if the increasing volatility swings prices up and down to balance the trend before going higher.
On the other hand, $9,000 seems to be a critical level where the general will gets confused — but Bollinger Bands Analysis anticipates values could stay around $10,000.
What do you think will happen to the bitcoin price? Share your predictions in the comments below.
If you find Ramiro’s analyses interesting or helpful, you can find out more about how he comes to his conclusions by checking out his primer book, the Manual de Análisis Técnico Aplicado a los Mercados Bursátiles. The text covers the whole range of technical analysis concepts, from introductory to advanced and everything in between. To order, send an email to [email protected]
Images via Pixabay, Ramiro Burgos
This technical analysis is meant for informational purposes only. Bitsonline is not responsible for any gains or losses incurred while trading bitcoin.


