

The bitcoin price plunged on Tuesday after facing another strong rejection from a psychological resistance area.
The leading cryptocurrency established a new intraday low near $7,274, down 5.11 percent from the local high of $7,552.92. The move downhill reasserted the $7,500-7,600 range as a crucial wall standing before bulls.
The area has rejected bitcoin’s upside attempts on four occasions since Friday. With the selling pressure high, the price has no option but to either consolidate or retest lower levels for strong pullbacks.
The dropdown came after Bakkt announced the release of its monthly options and cash-settled bitcoin futures. It showed traders are completely sidelining the market-moving catalysts, especially the ones that attribute to the bitcoin adoption at institutional scales.
Bakkt, an Intercontinental Exchange-backed digital assets platform, promised to become a bridge between crypto and Wall Street. But with traders sidestepping its growth in the space, it appears bitcoin is establishing its interim bias purely based on technical factors.
That Redded Range
Bitcoin’s rejection of the purpled resistance range, as shown in the chart below, confirmed the cryptocurrency’s inclination to test the redded historical support area.
As discussed in the previous coverage, the redded range behaved as support during bitcoin’s downtrend in 2018 – and resistance in 2019. More so, bitcoin is trending inside a descending parallel channel.
The growing selling pressure could prompt the price to test the Channel Support which – again – is dipped inside the redded range.
So it appears, bears can play bitcoin down towards the $6,000-6,500 area in medium-term, creating ample opportunities for short traders to make decent profits.
Meanwhile, a bounce-back from the redded area – or above, could have traders open long entries towards the purpled range, defined by $7,500-8,500.
1 Hour Chart (Featuring A Risky Bitcoin Trade)
The latest price action has also influenced bitcoin to break out from the Symmetrical Triangle discussed in the previous analysis. As of now, the price has established interim support near $7,272. At the same time, the $7,386 level is behaving as resistance.
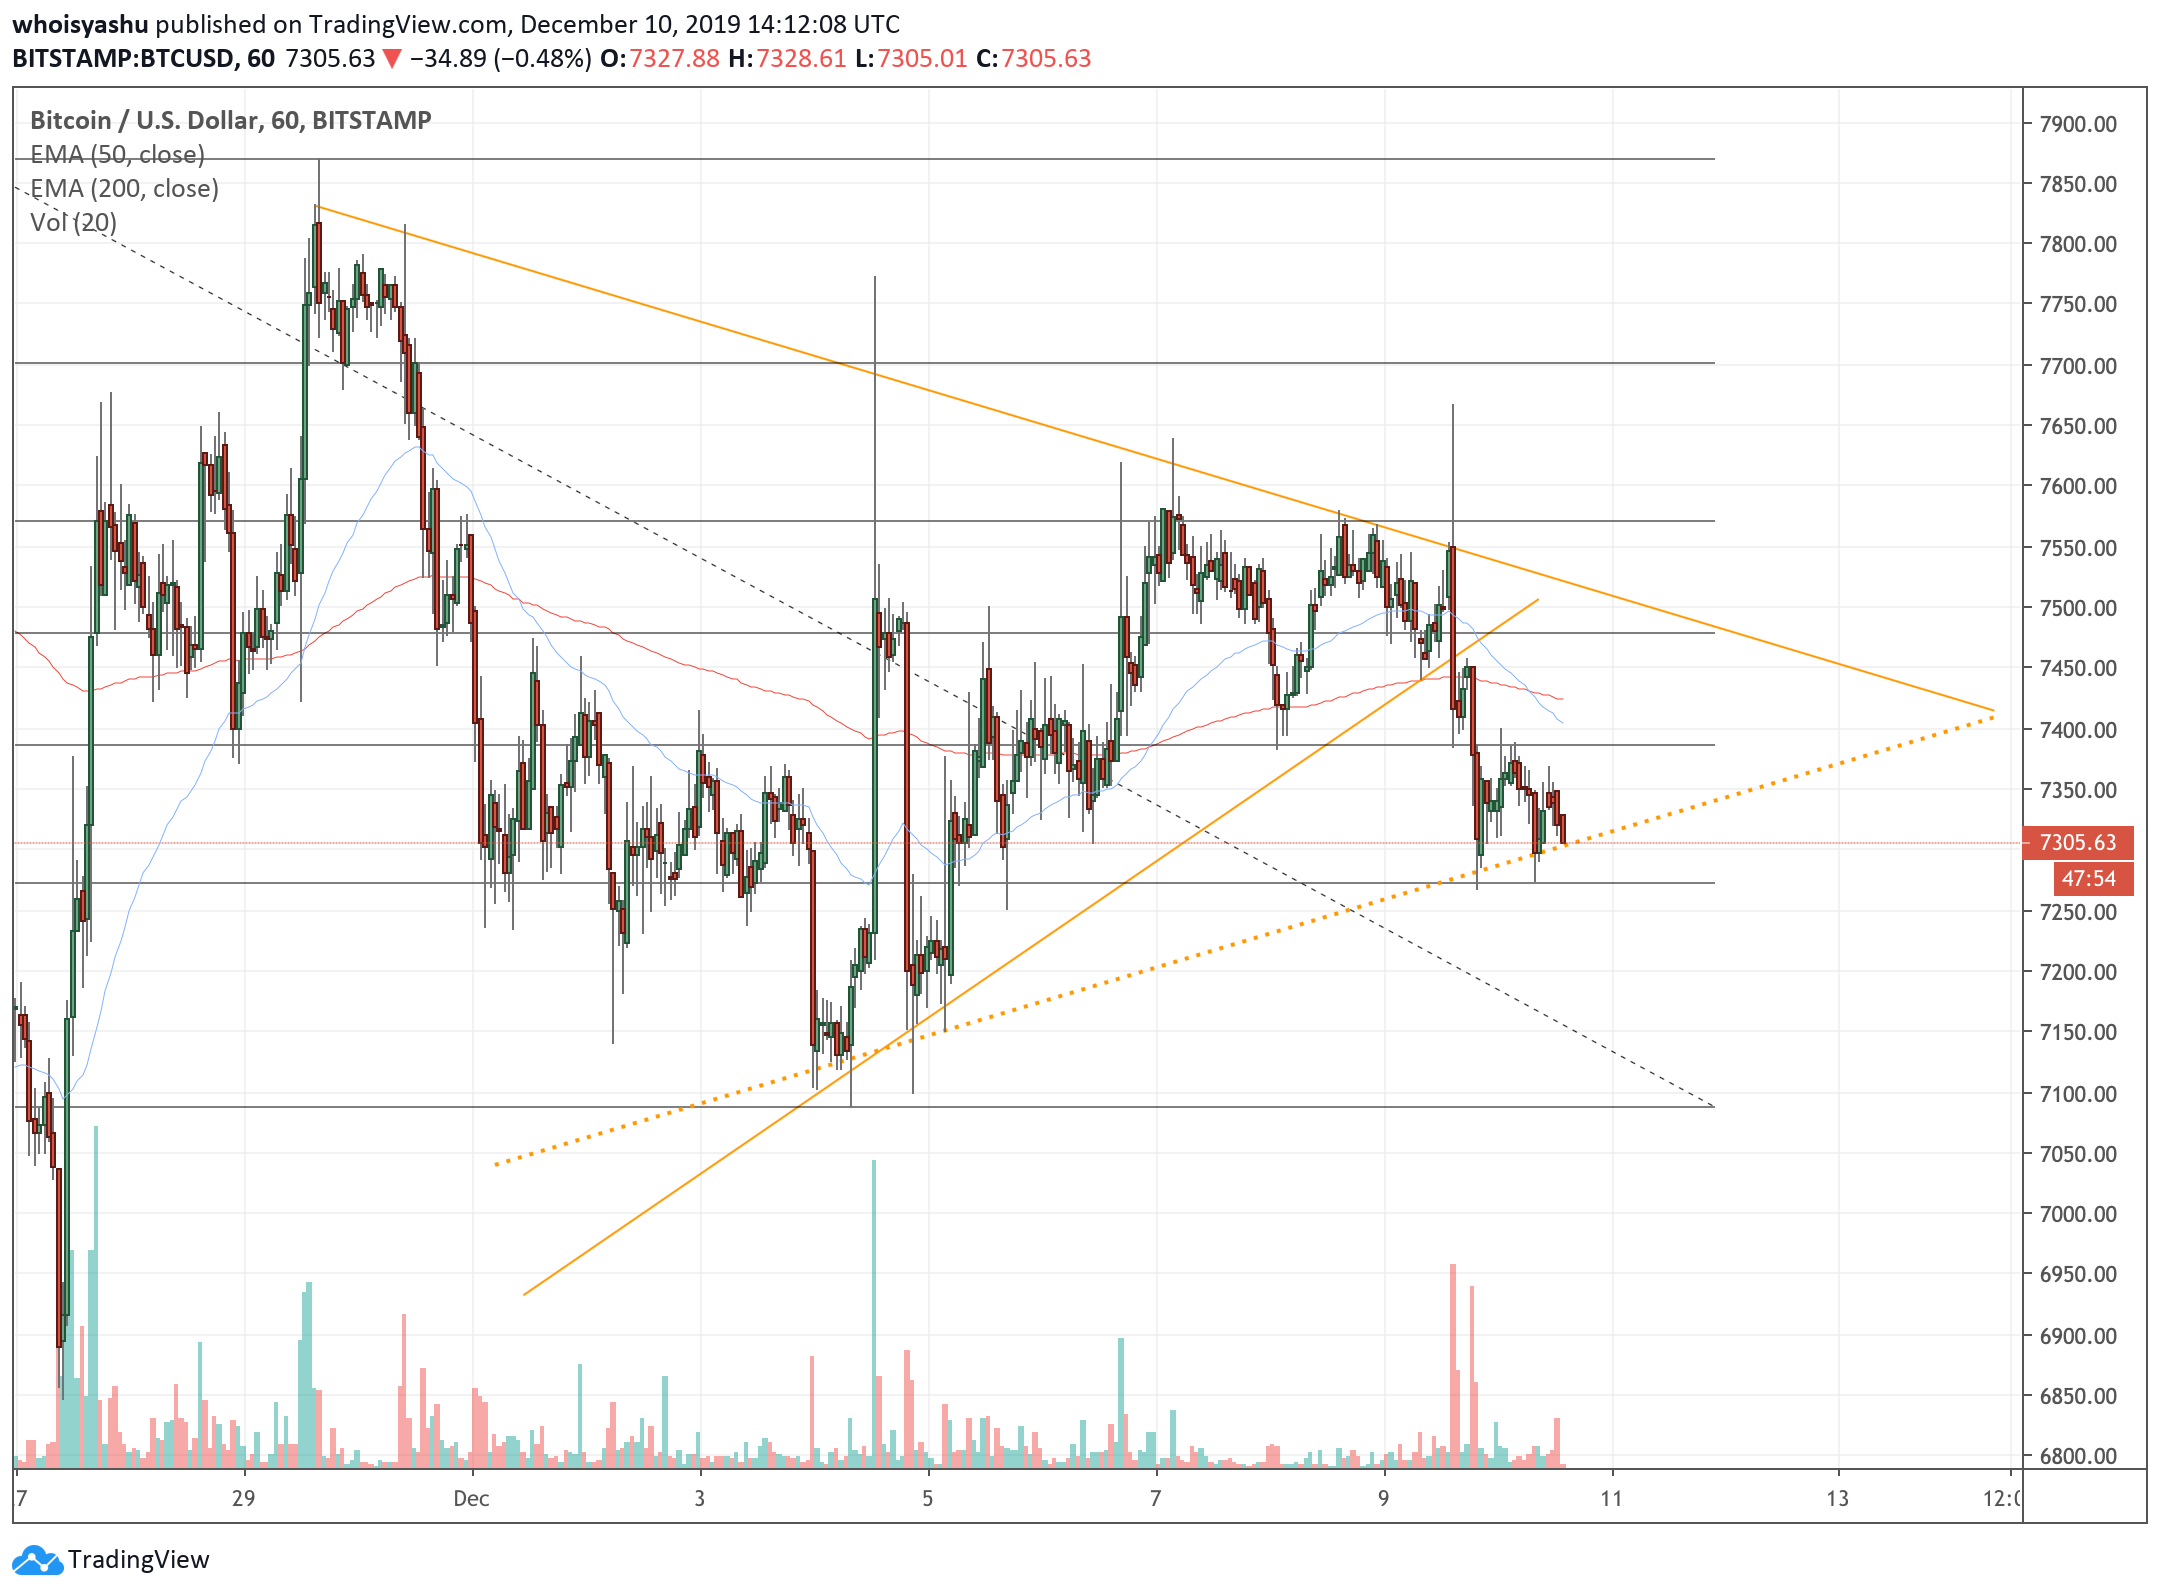
Symmetrical Triangle borns a breakdown during Tuesday trade | Source: TradingView.com, BitStamp
The range is decently spread to place open small intraday positions. For instance, a long entry towards $7,386 while maintaining a stop loss below support could yield decent returns.
Similarly, opening a short position towards $7,272 on a pullback from resistance while keeping a stop order opened near $7,400 looks attractive.
But, at the same time, traders with risk-appetite can consider a long position towards the Channel Resistance after treating the ‘DASHED’ ascending trendline as Channel Support.
The price has just bounced back from the unconfirmed support. At this point, a surprise jump in volume with a green candle formation on hourly charts could just be the signal to open a Long trade.
However, maintaining a stop loss below the DASHED trendline could be a decent risk management exercise to reduce losses (should the price moves in the downward direction).
[Disclaimer: The opinion expressed in this article are of the author and author only. Readers’ discretion is advised.]

 Correcting Gains, Why Dips Remain Attractive")
