

Anticipation Builds as Bitcoin Price Holds Steady for Too Long
September 2, 2019 by Ramiro Burgos
Is the bitcoin price frustratingly calm for you too? Hold steady. The $10,000 USD level exposes our current lateral market to external factors for another month, meaning any News could turn on an major 4,000 basis point movement. Read our weekly technical analysis to find out more.
Also read: Bitcoin Price May Stay at $10K for a While, but Watch for a Jump
Subscribe to the Bitsonline YouTube channel for great videos featuring industry insiders & experts
Bitcoin Price Technical Analaysis
Long-Term Analysis
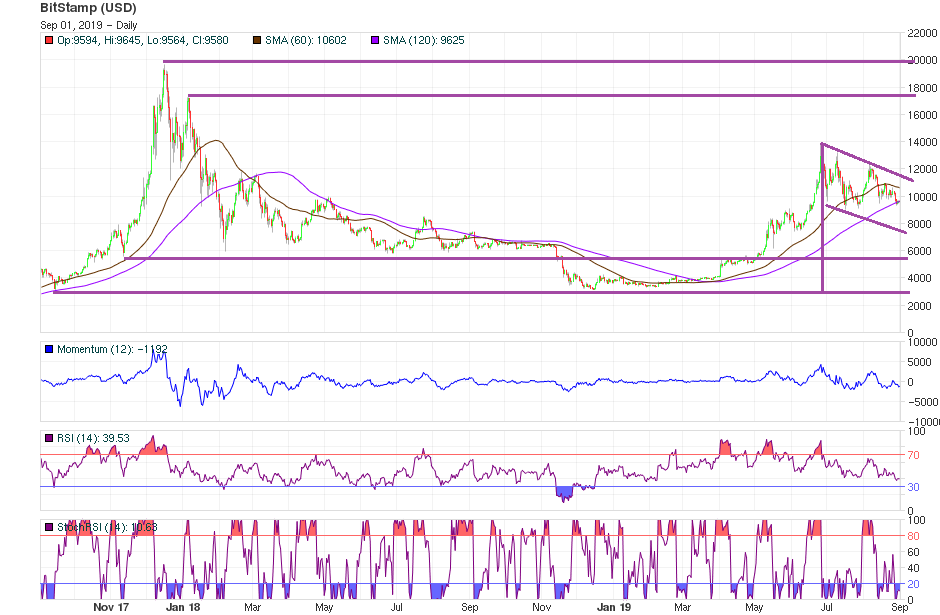
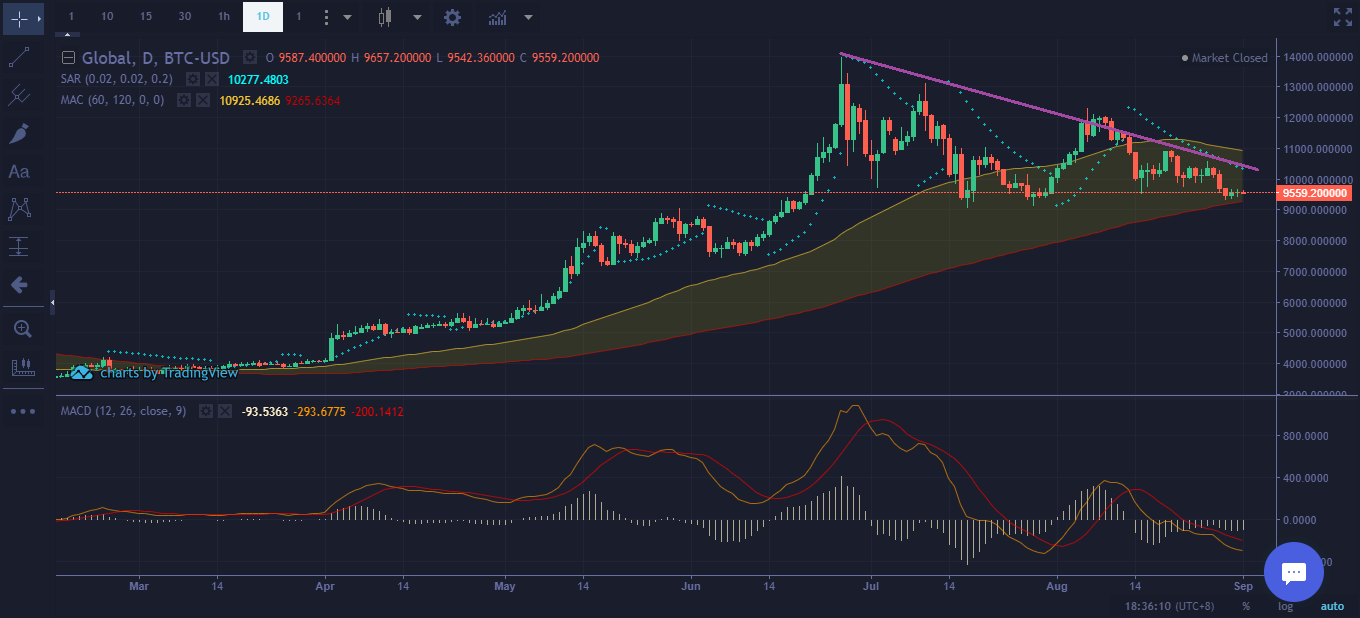
Prices are still maintaining a sideways lateral market around $10,000, which could last for another month. Meanwhile, a Bullish consensus gains strength and, from this point, any News could switch on an upward rally which overcome the $12,000 intermediate resistance.
The action is still moving on across a high-volatility 3,000 basis point stage, recognizing $9,000 as a support and a target near $15,000. The Hope phase from Mass Psychology Analysis seems to be recovering, creating a safety sensation on the bullish chance — but will depend on external factors to give way to Optimism, if and when values overcome $12,000.
On the other hand, should the current distribution pattern remain active, and in case the $9,000 support level gets broken, our next scenario would include a deep fall to $6,000. However new participants entering the market from other industries, and the general public adding crypto to their portfolios, could balance the offer/demand relationship to favor a bullish rally, moving institutional investors to re-enter the game.
Mid-Term Analysis
Mathematical Indicators arrived at their bottom and should start to turn over bringing positive signals, while quotes keep reinforcing the lateral development structure around $10,000. High volatility action could be considered a reason to allow that bullish chance, now backed by technicians, if the current dispersed and erratic general will is joined by some News or external factor stimuli.
If the bitcoin price leaves its current lateral market and walks away from the influence of the current bearish trend, values could stick to a new third upward Elliott Wave and overcome $12,000, triggering a bullish rally.
Short-Term Analysis
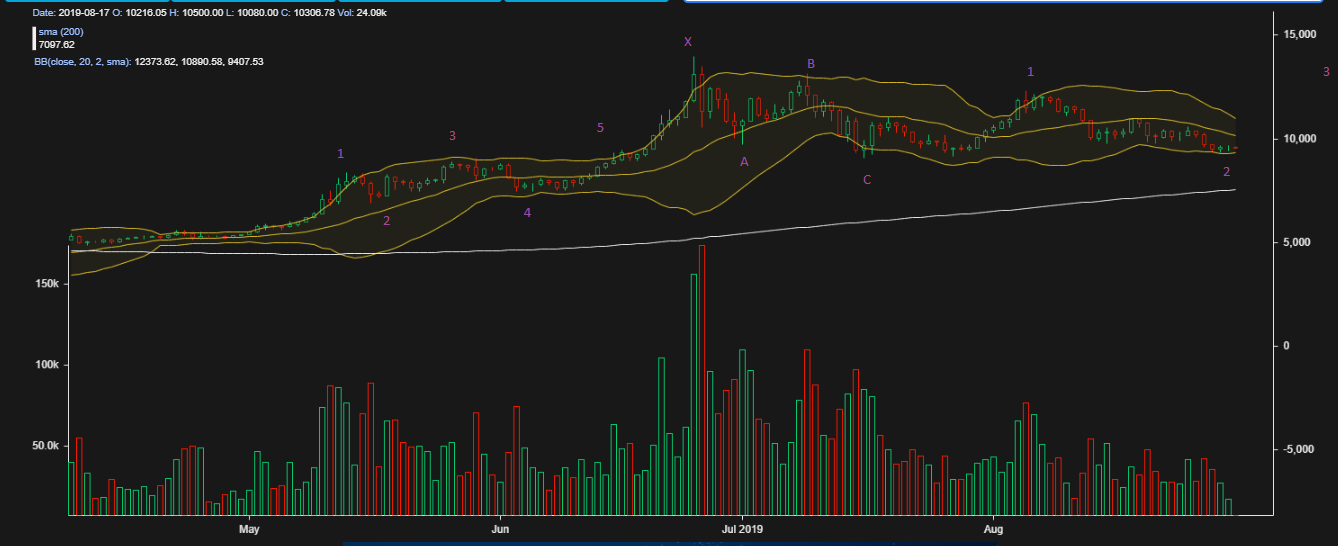
Elliott Wave Theory’s counting seems to have finished a corrective second wave and should be ready to start a third upward movement. marching the $12,000 level. If the sideways movement sustains that $10,000 level for another month, it would include the fourth corrective wave from $14,000 back to $10,000 in October, and the 5th upward one to higher levels in November.
Japanese Candlestick Fairy Soldiers are still defending the current level from offer’s Crow distribution action and show muscle to prevail in battle — driving a major movement to higher targets near the end of 2019.
Bollinger Analysis is still negative, reflecting prices below the centerline to stay around the lower band, while Soldiers order themselves to balance current selling pressure.
If offering action gets reinforced by some harmful external factors which are expected to arrive in favor of a bullish chance, panic could prevail in the distribution action. If so, all the activity could shift down to get locked for another two months at a lower level between $9,000 and $7,000, staying within the current bearish channel.
What do you think will happen to the bitcoin price? Share your predictions in the comments below.
If you find Ramiro’s analyses interesting or helpful, you can find out more about how he comes to his conclusions by checking out his primer book, the Manual de Análisis Técnico Aplicado a los Mercados Bursátiles. The text covers the whole range of technical analysis concepts, from introductory to advanced and everything in between. To order, send an email to [email protected]

Images via Pixabay, Ramiro Burgos
This technical analysis is meant for informational purposes only. Bitsonline is not responsible for any gains or losses incurred while trading bitcoin.


