

Like most other crypto assets, Ethereum has slipped lower over the past four days. After peaking on Monday, all cryptocurrencies have retraced as Bitcoin has fallen lower seemingly due to a rise in the value of the U.S. dollar against foreign currencies.
Ethereum has actually underperforming Bitcoin in this retracement, dropping around 11.5% from its year-to-date highs as opposed to just 7%. This seems to be the case with all altcoins, whereas capital flooded to BTC during the correction as investors sought safety.
Despite some fearing this downtrend is set to continue, an analyst has noted that Ethereum still has a bullish market structure. This market structure could fuel a move back to the upside.
Related Reading: Crypto Tidbits: MicroStrategy’s $250m Bitcoin Purchase, Ethereum DeFi Boom, BitMEX KYC
What’s Next for ETH?
According to a pseudonymous analyst, ETH is still in a good spot against Bitcoin. He shared the chart below on August 22nd to explain his sentiment; it shows that Ethereum is still trading above important levels against Bitcoin, including 0.032 BTC.
“My thoughts on $ETHBTC here: Bullish MS still clearly intact, dips are for buying. Clean sweep & reclaim of the 0.032 is my trigger, targeting 0.042 & 0.053.”
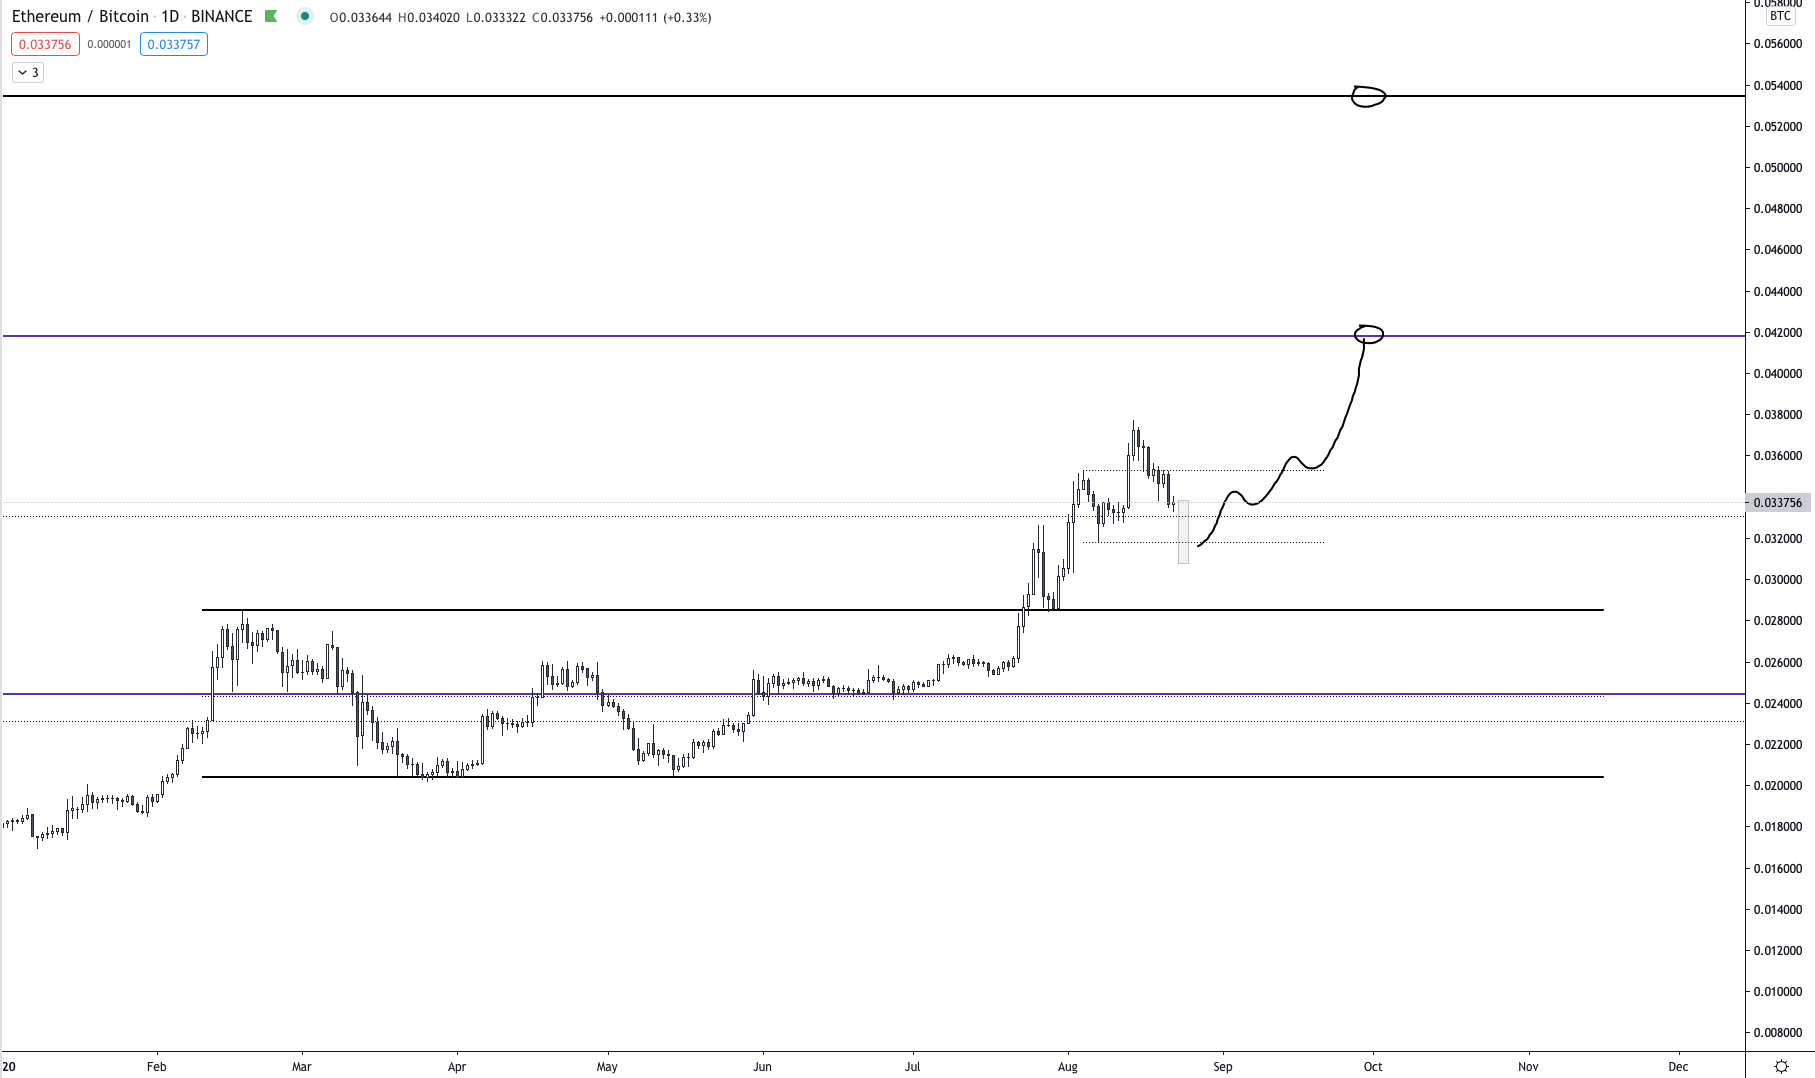
Chart of ETH's price action against Bitcoin since the start of the year with analysis by trader CryptoTrooper (@Cryptotrooper_ on Twitter). Chart from TradingView.com
This bullish sentiment is actually contrarian; that’s to say, most analysts are actually bearish on Ethereum at the moment.
Another trader noted that the recent drop in the ETH/BTC pair is actually more technically damaging than depicting above. “Looks like a local top,” one quipped in reference to the indicators. “Daily RSI and low tf ema are bearish and so is weekly stochastic RSI.”
Imminent Bitcoin Volatility Could Hurt Ethereum
Bears may actually have the upper hand, especially considering the volatility Bitcoin is likely to soon undergo.
Brave New Coin analyst Josh Olszewicz shared the chart below last week. While it does not factor in the recent correction, it shows that the Bollinger Bands on Bitcoin’s medium-term chart are getting tight once again.
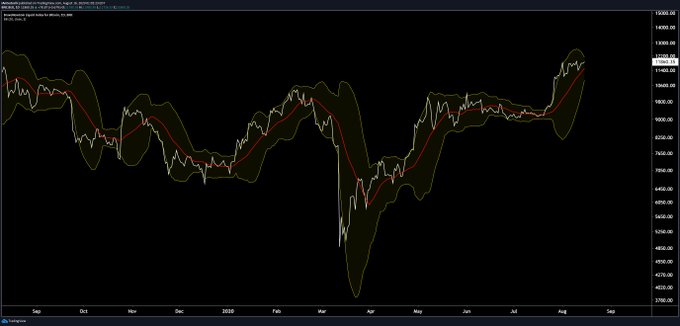
Chart of BTC's price action over the past year with the Bollinger Bands indicator by trader Josh Olszewicz (@CarpeNoctum on Twitter). Chart from Tradingview.com Ethereum
The Bollinger Bands is an indicator that denotes important technical price levels along with the volatility of a market. It can be used on any market, from Bitcoin and Ethereum to stocks and bonds.
Per Olszewicz’s analysis, the width of the Bands is reaching a level historically seen prior to a spike in volatility. Last time the indicator was this tight was in February 2020, just prior to the March capitulation event.
As altcoins like Ethereum thrive when Bitcoin volatility is low, a spike in that volatility could hurt this segment of the cryptocurrency market.
Related Reading: Crypto Tidbits: Dave Portnoy Drops Bitcoin, Tether Supports Ethereum’s OMG Network, DeFi Still Hot
Featured Image from Shutterstock
Price tags: ethusd, ethbtc
Charts from TradingView.com
Analyst on Why Ethereum's Bullish Market Structure Is Intact After Strong Drop


 Price Scorches To 130% Rally Despite Frozen Network Accounts")