

It’s been another bullish week for Bitcoin (BTC) as the price surged past the critical $7,200 resistance, as mentioned in last week’s analysis, all the way to $7,300.
However, the price has corrected slightly and is now sitting just below $7,200. So was this the local top? Or has the leading digital asset got some steam left in it ahead of the halving event that is now about three weeks away?
Daily crypto market performance. Source: Coin360.com
Bitcoin’s slow grind to $10K

BTC USD daily chart. Source: TradingView
Starting out with the daily chart for Bitcoin, we can see that BTC has successfully flipped the resistance of the long-standing descending channel into support. The argument for this channel’s validity is that in January of this year, the breakout was a bull trap and that for this to occur twice would invalidate this channel.
As such, in the chart above I plotted two different scenarios: “Bullish” and “Permabear.” The bullish channel here is quite a conservative trajectory — one that in all honesty suits my personal belief for Bitcoin — and a new path that shows a slow grind to $10,000 by September 2020.
This sets the resistance for the week ahead at around $7,900 with support on the channel at around $6,400.
A return to the previous descending channel, in another alleged pandemic related sell-off, could put Bitcoin on a trajectory to zero within the same timescale. So for obvious reasons, I have a somewhat bullish bias right now. But ultimately, which scenario looks more likely to you here? No one really expects for Bitcoin to go zero. After all, it’s not a DeFi dapp! (Too soon?)
The fact of the matter is that there are some interesting fractals playing out, along with other incredibly bullish signs right now.
The weekly MACD is playing out as it did at the bottom
The weekly moving average divergence convergence (MACD) indicator looks set to cross bullish in a week from tomorrow.
In other words, we are currently seeing exactly the same pattern play out that we saw between July 2018 where we had a false bullish cross followed by a 50% correction that saw the next bullish cross lead to a 266% increase in value for Bitcoin.

BTC USD weekly MACD chart Source: TradingView
I have been mentioning this exact pattern since December last year, and should Bitcoin maintain its upward momentum for another week, one can’t help but get excited about the possible upside ahead of us, especially with the halving being less than 23 days away.
There are of course other factors to consider, and I wouldn’t want to be branded a “bull-tard” based on a couple of trend lines and an indicator. Over recent weeks in the wake of the coronavirus pandemic, the correlation between Bitcoin and the traditional markets has become noticeable, and should we slip into a deeper global depression, it could realistically have a dramatic effect on the price of Bitcoin until there is a decoupling.
Market correlation is strong
The recent correlation since the beginning of 2020 is something that can’t be ignored. However, neither is the last two months of 2019 where Bitcoin slumped during a period of strong economic growth.

BTCUSD weekly Comparison with S&P 500 and Mini Futures chart Source: TradingView
I suppose one could argue that a Christmas sell-off by retail could have added to the extra selling pressure from miners, but that’s a theory for another day.
Today I want to focus on the now, and the fact that currently, the Bitcoin price action is closely following that of the S&P 500. And as popular YouTuber Sunny Decree has pointed out lately, the S&P Mini futures are serving as a valid indicator for future price action.
In the chart above, you can see the S&P mini futures in blue and the S&P 500 in yellow. The mini futures are showing another spike that both Bitcoin and the S&P are yet to reflect, Thus, the validity of this as an indicator will prove itself throughout the day tomorrow.
However, with all reliable indicators, they are only reliable until they aren’t, and one such example of this is the CME gap filling.
The CME gap at $8,490

BTCUSD weekly CME chart Source: TradingView
Throughout 2019 and early 2020 this was an incredibly reliable indicator, but it hasn’t really been a thing since “Black Thursday.” That isn’t to say that it won’t fill again though, especially now that the price is starting to pick up.
Combining the recent growth of Bitcoin over the last few weeks and the correlation appearing with the S&P mini futures, a spike next week could see the gap at $8,490 close, which would represent 18% growth from the current price.
This again is another bullish case for Bitcoin to continue on its upward path, and this is further echoed by the increase in mining difficulty, which is now set to wipe out the drop incurred as a result of the March 12 price plunge.
Mining difficulty back on the rise

BTC mining difficulty. Source: BTC.com
In a little over 24 hours, the mining difficulty is expected to increase by nearly 9%. Earlier in 2020, this saw the price follow by a greater percentage.
With this in mind, an increase of 9% in difficulty could lead to an increase of price greater than 10%, which could see the leading digital asset reclaim that important $8K zone, which in turn, makes the CME gap-filling look increasingly likely.
However, all of these indicators only point up, and it would be naive to assume that this is the case for Bitcoin. So what bearish indicators are there?
One metric that’s been building up over the last few weeks is the sheer amount of value across major stablecoins.
$7.6 billion sitting on the sidelines
According to data on Coin360, there is currently nearly $7.6 billion parked in stablecoins. This is made up as follows:
- USDT = $6.37BN
- USDC = $732M
- PAX = $265M
- BUSD = $35M
- TUSD = $221M
Wearing a bull hat, this could be interpreted as the most bullish indicator of all time. This is enough to buy over 1 million BTC.
If you combine this with the narrative that miners led the 50% dump on March 12 with around 300K BTC as covered in my analysis on March 22, you can then put together a picture that potentially a third, if not more of the stablecoins being held, could be in the hands of larger miners waiting to the drive the price.
In fact, it’s my personal belief that both large miners and large exchanges make up the vast majority of those that hold stablecoins.
However, when wearing a bear hat, and assuming that it is not exchanges and miners holding the lion share of stablecoins, you have to ask the questions: what do these holders know that I don’t? And is another leg down something that those holding stablecoins are anticipating, and if so, why?
Once such chart that caught my eye was that of twitter user EscobarTrader:
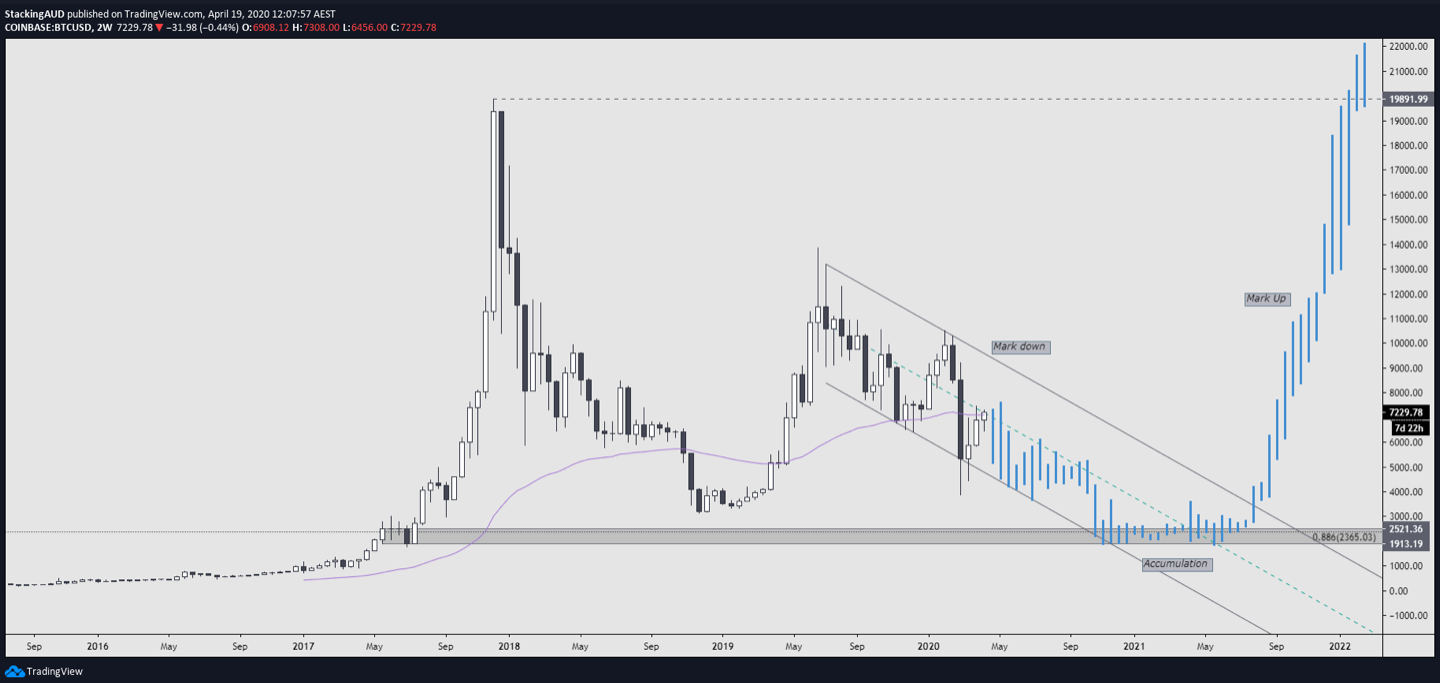
Source: Twitter @EscobarTrader
Much like my case for Bitcoin going to zero, this chart on the 2 weekly view shows that we remain in a valid downward channel that we are yet to break out of.
Should Bitcoin fail to establish a new ascending pattern, this particular chart points to sub $2K accumulation levels by the end of this year. Perhaps this is the chart those holding on to stablecoins are holding out for, and falling below $6,400 over the coming week would give weight to this theory.
The views and opinions expressed here are solely those of @officiallykeith and do not necessarily reflect the views of Cointelegraph. Every investment and trading move involves risk. You should conduct your own research when making a decision.


