

Bitcoin (BTC) stuck to a narrow trading range into April 7 as crypto analysts awaited the week’s main United States macroeconomic data.
$30,000 or $25,000 for Bitcoin?
Data from Cointelegraph Markets Pro and TradingView confirmed another day’s ranging around $28,000 for BTC/USD.
The pair had shunned volatility over most of the week, but now faced nonfarm payroll (NFP) numbers as a final potential catalyst for risk assets.
“Expectations are that we’ll be seeing 3.6%, similar to last month. Based on the financial numbers of this week, I’d rather expect 3.7-3.8%,” Michaël van de Poppe, founder and CEO of trading firm Eight, summarized about his expectations.
“Result; $DXY down, $BTC unchanged and indices down/up depending on how far the outlier will be.”
A further Twitter post argued that $30,000 remained on the table should bulls protect current support levels.
“Bitcoin remains in a boring state of mind. Consolidating for weeks, while old altcoins are breaking out,” he continued.
“I’m still looking at support here, through which $27,600 needs to sustain. If that’s lost, $25,000-25,400 seems likely. Holding here through NFP -> $30,000 next.”

Related: $1.12B in Bitcoin options expire this week, and bulls appear to be at a disadvantage
Fellow trader Crypto Tony agreed that the current trading range may nonetheless prove sticky.
“I bet we will be staring at this range for awhile. If we do range for awhile and Alts start to run, it only confirms the capital flow is in motion,” he forecast on the day.
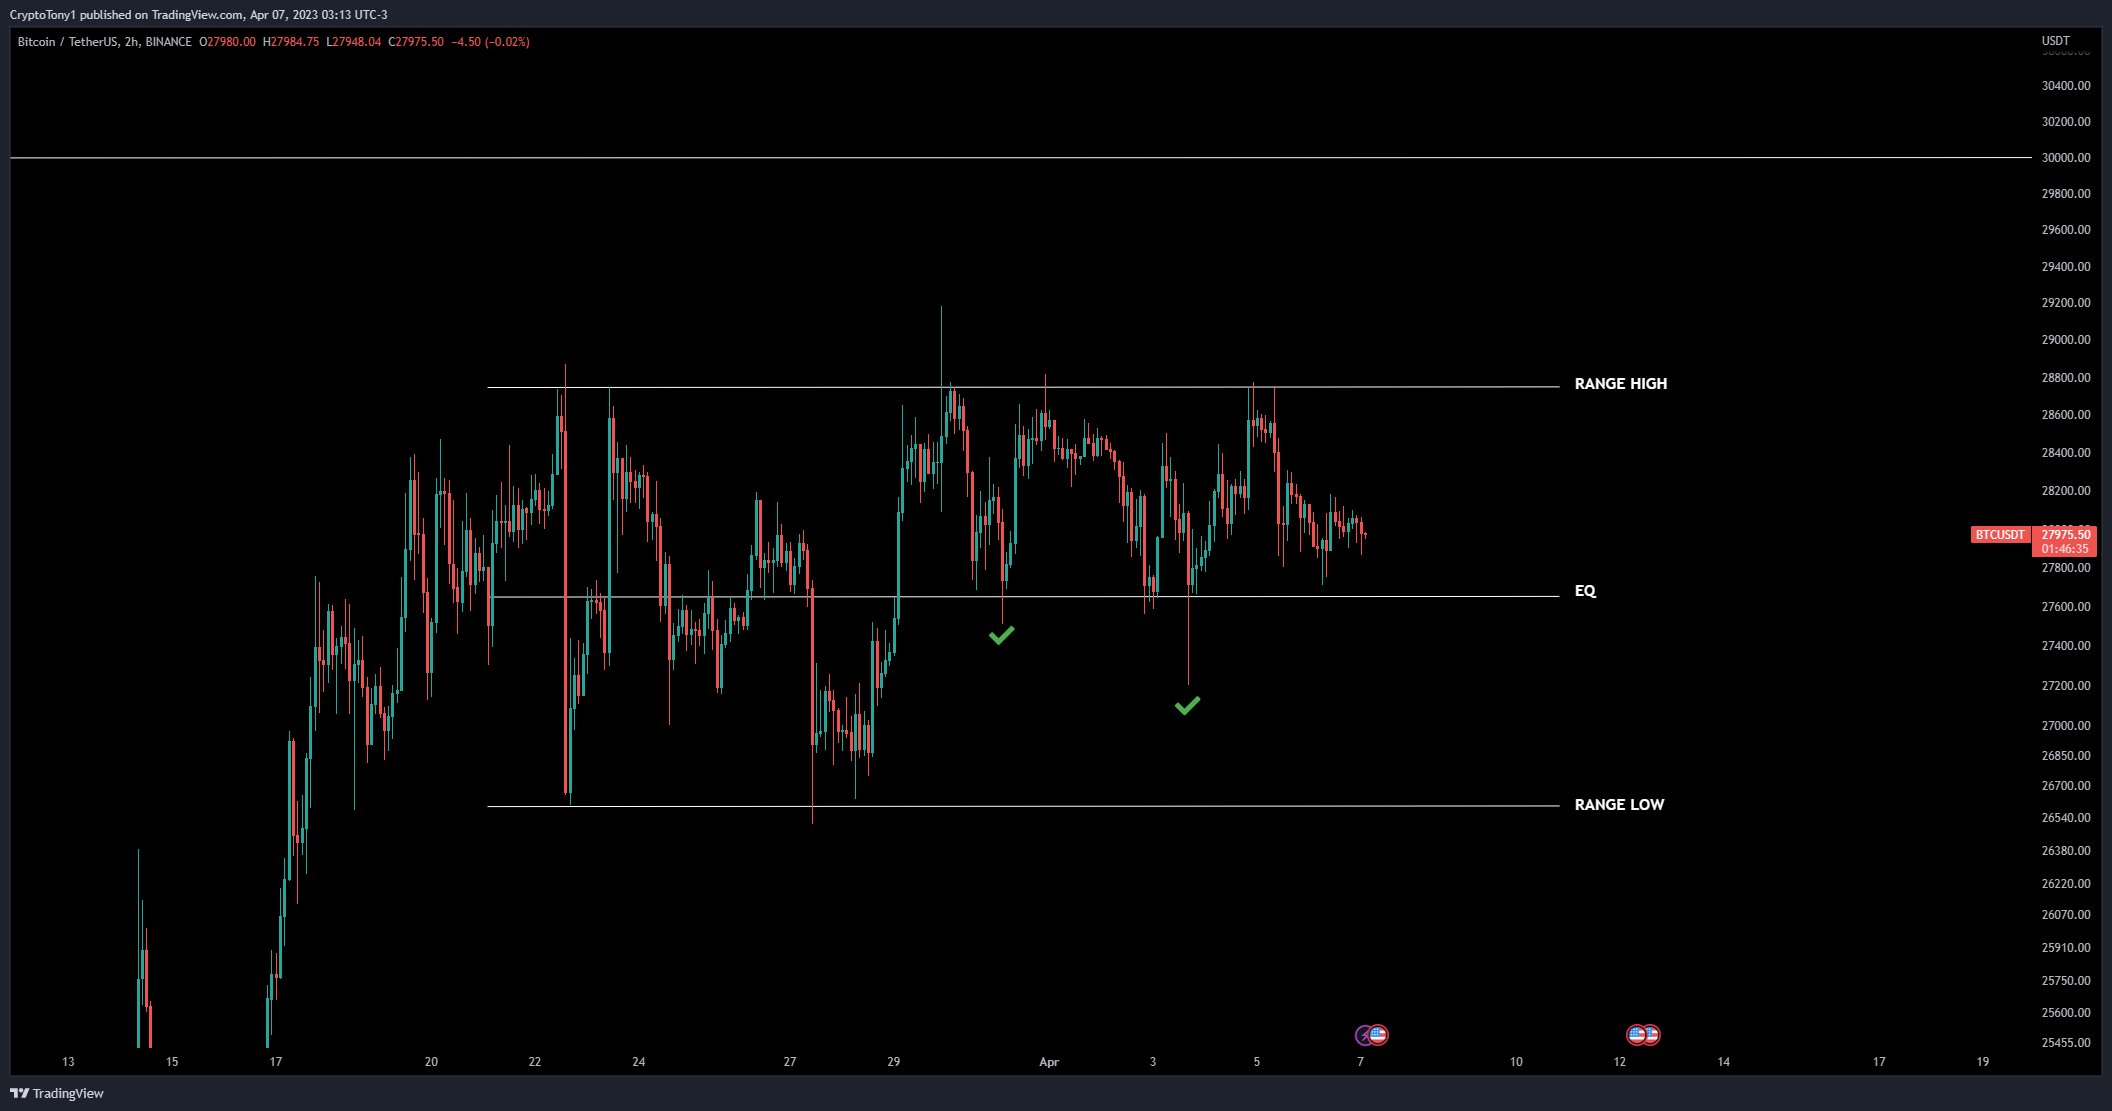
Popular trader Anbessa showed similar downside targets to Van de Poppe, eyeing $27,940 as an important intraday level to defend.
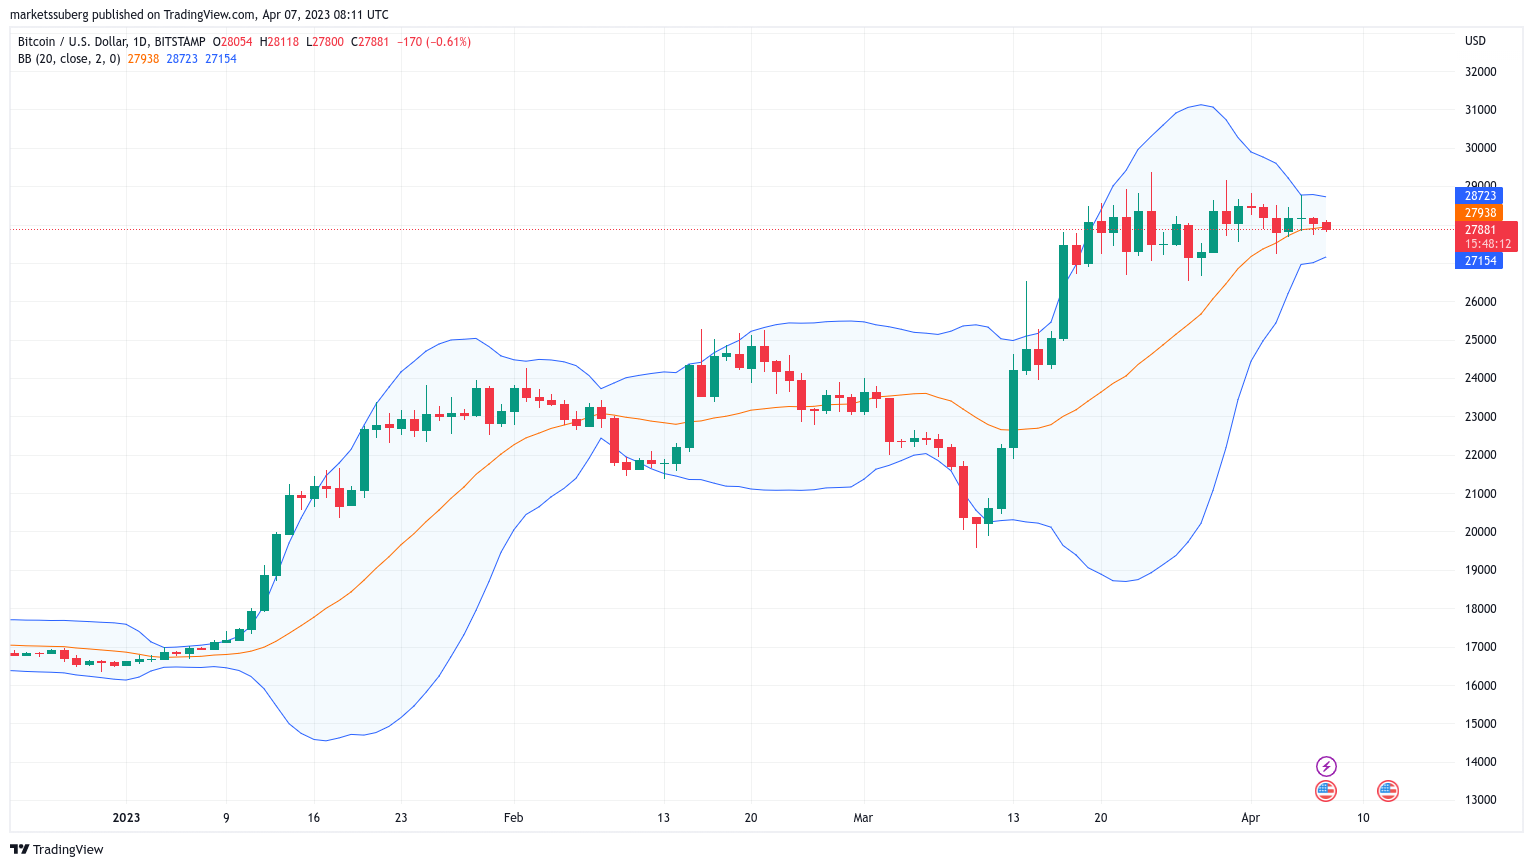
Bollinger bands portend BTC price volatility
Examining volatility, meanwhile, popular analyst HornHairs noted that Bollinger bands were offering a telltale sign that calm conditions were about to break.
Related: Bitcoin ‘faces headwinds’ as US money supply drops most since 1950s
“Bitcoin volatility contraction as tight as its been all year. The games shall begin shortly. Dust off your weapons of choice for the volatility ahead,” he advised.
An accompanying chart confirmed the Bollinger bands “squeezing” around spot price, reflecting the current tight range, with the implication that a challenge of the upper or lower band should soon begin.
As Cointelegraph reported, 2023 has been a year of contrasting volatility phenomena, with BTC/USD gaining 40% in January but ending February almost exactly at its starting position.
March upside totaled 23%, while in April, Bitcoin is currently down 2.3%, according to statistics from Coinglass.

The views, thoughts and opinions expressed here are the authors’ alone and do not necessarily reflect or represent the views and opinions of Cointelegraph.

