

Ethereum reacted to the downside after it failed to clear the $215 resistance against the US Dollar. ETH price is currently showing bearish signs and it could decline to $200 or $192.
- Ethereum is slowly moving lower and now trading well below the $215 resistance.
- The price is struggling to stay above $210 and the 100 hourly simple moving average.
- There is a major bearish trend line forming with resistance near $214 on the hourly chart of ETH/USD (data feed via Kraken).
- The pair is likely to continue lower below $205 and $200 as long as it is below $215.
Ethereum Price Likely To Lose Battle Near $215
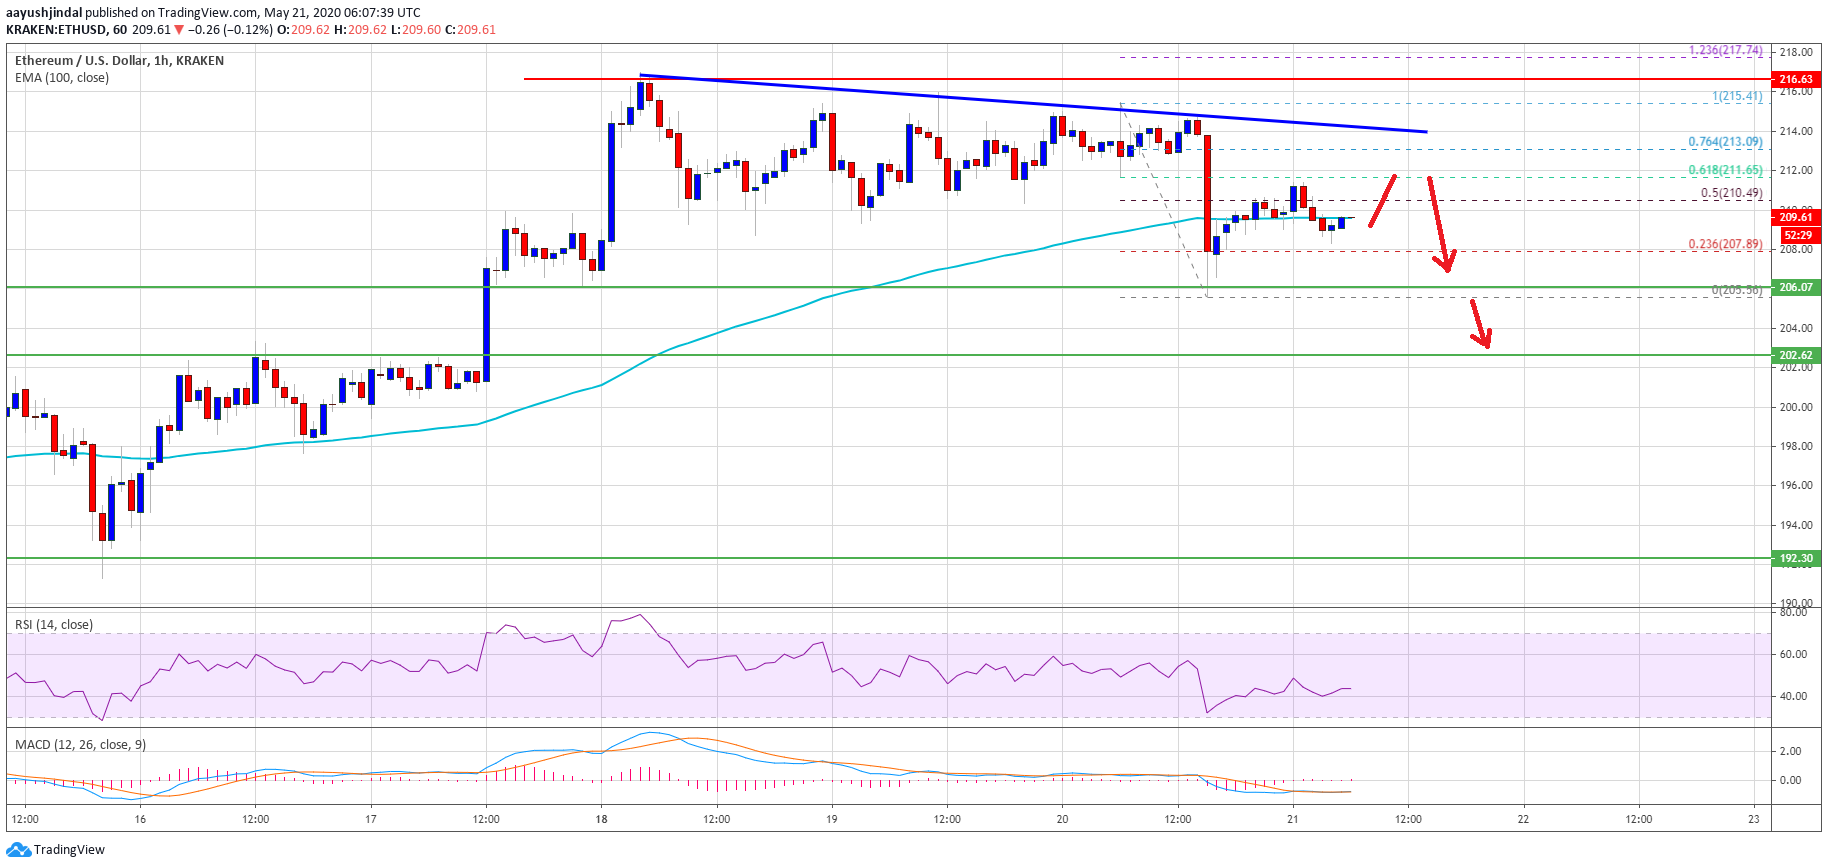
Ethereum price made many attempts to clear the $216 resistance zone against the US Dollar, but it failed. ETH price formed a swing high near $215 and recently started a fresh decline.
There was a break below the $212 and $210 support levels. Ether even broke the $208 support and the 100 hourly simple moving average. However, the $205-$206 support zone stalled the recent decline.
A low is formed near $205 and the price is currently correcting losses. It tested the $210 level, which acted as a resistance. The 50% Fib retracement level of the recent decline from the $215 high to $205 low is also acting as a resistance.
On the upside, there are many hurdles forming near $214 and $215. There is also a major bearish trend line forming with resistance near $214 on the hourly chart of ETH/USD.
The trend line is close to the 76.4% Fib retracement level of the recent decline from the $215 high to $205 low. A clear break above the $215 resistance area is still a major task. If the bulls finally succeed, there are chances of a strong upward move towards the $220 and $230 levels.
More Losses?
If Ethereum fails to clear the $214 and $215 resistance levels, there could be another decline. The main support is near the $205 and $206 levels.
The current price action, the trend line resistance, and multiple rejections near $215 suggest chances of more losses. There three takeaways could lead the price below $205 in the near term.
If there is a downside break below the $206 and $205 support levels, the price is likely to accelerate towards the $200 level. Any further losses could open the doors for a larger decline towards the $192 support zone.
Technical Indicators
Hourly MACD – The MACD for ETH/USD is slowly gaining pace in the bearish zone.
Hourly RSI – The RSI for ETH/USD is now well below the 50 level, with a bearish angle.
Major Support Level – $205
Major Resistance Level – $215
Take advantage of the trading opportunities with Plus500
Risk disclaimer: 76.4% of retail CFD accounts lose money.


