

- A prolonged period of low volatility is setting Bitcoin towards a big price move.
- The short-term bias for the cryptocurrency remains neutral as it trades inside a $300 trading range.
- Nevertheless, three separate technical indicators put Bitcoin at the risk of breaking lower towards $8,500.
Buckle up, Bitcoin traders!
The sailing from here could get bumpier as the cryptocurrency continues to trade strictly inside a $300 trading range. BTCUSD has repeatedly failed to sustain a rally above its short-term resistance level at $9,300. Meanwhile, an equally stubborn support level at $9,000 has capped the pair from extending its bearish bias.
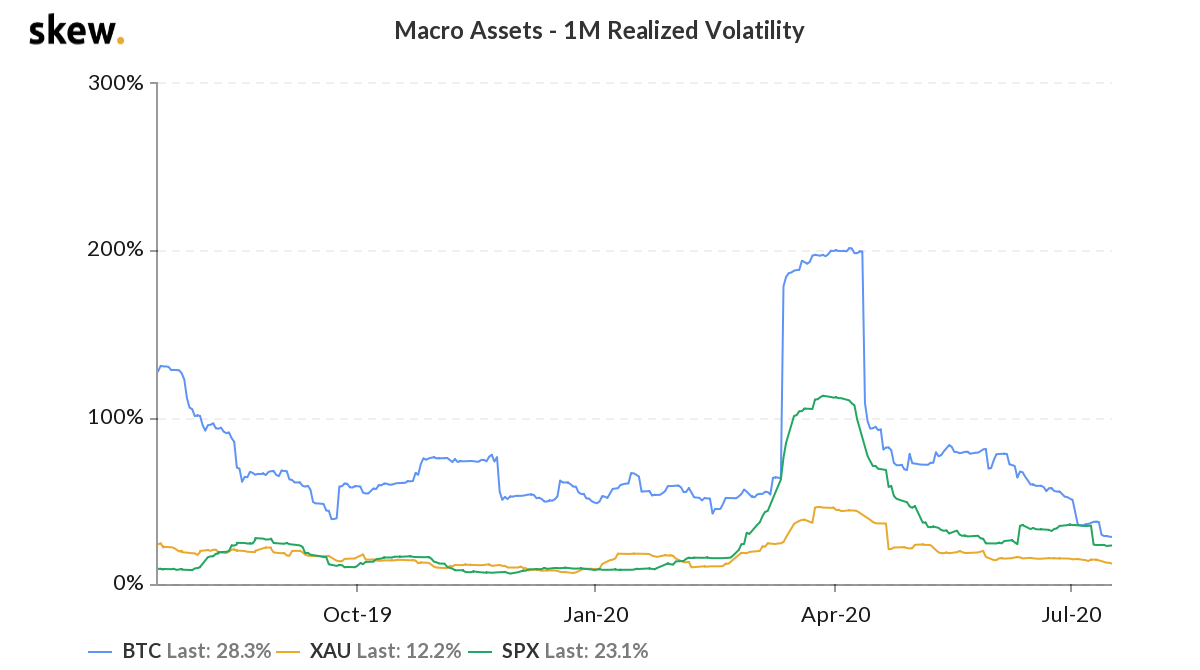
The flat and dull price action is reflective of the Bitcoin’s volatility. Data provided by Skew.com shows that the cryptocurrency has been least volatile in more than two years, with its one-month Realized Volatility falling towards 28.3 percent.
Bitcoin 1-Month Realized Volatility dips. Source: Skew
A sustained period of low volatility typical prompts an asset to undergo a breakout move. Bitcoin is on a similar path. However, it is difficult to predict the direction of its next significant price action.
At the same time, two technical indicators with a credible history of predicting market trends see BTCUSD falling in the coming sessions.
#1 Bitcoin’s 50-Weekly Moving Average
Zooming out a typical Bitcoin chart from daily to weekly shows the cryptocurrency in a downtrend since its December 2017 top.
The long-term market outlook shows a string of technical indicators that accurately foretold the direction of Bitcoin’s next price moves. One of them was and remains to be the 50-weekly moving average, as shown via blue wave in the chart below.
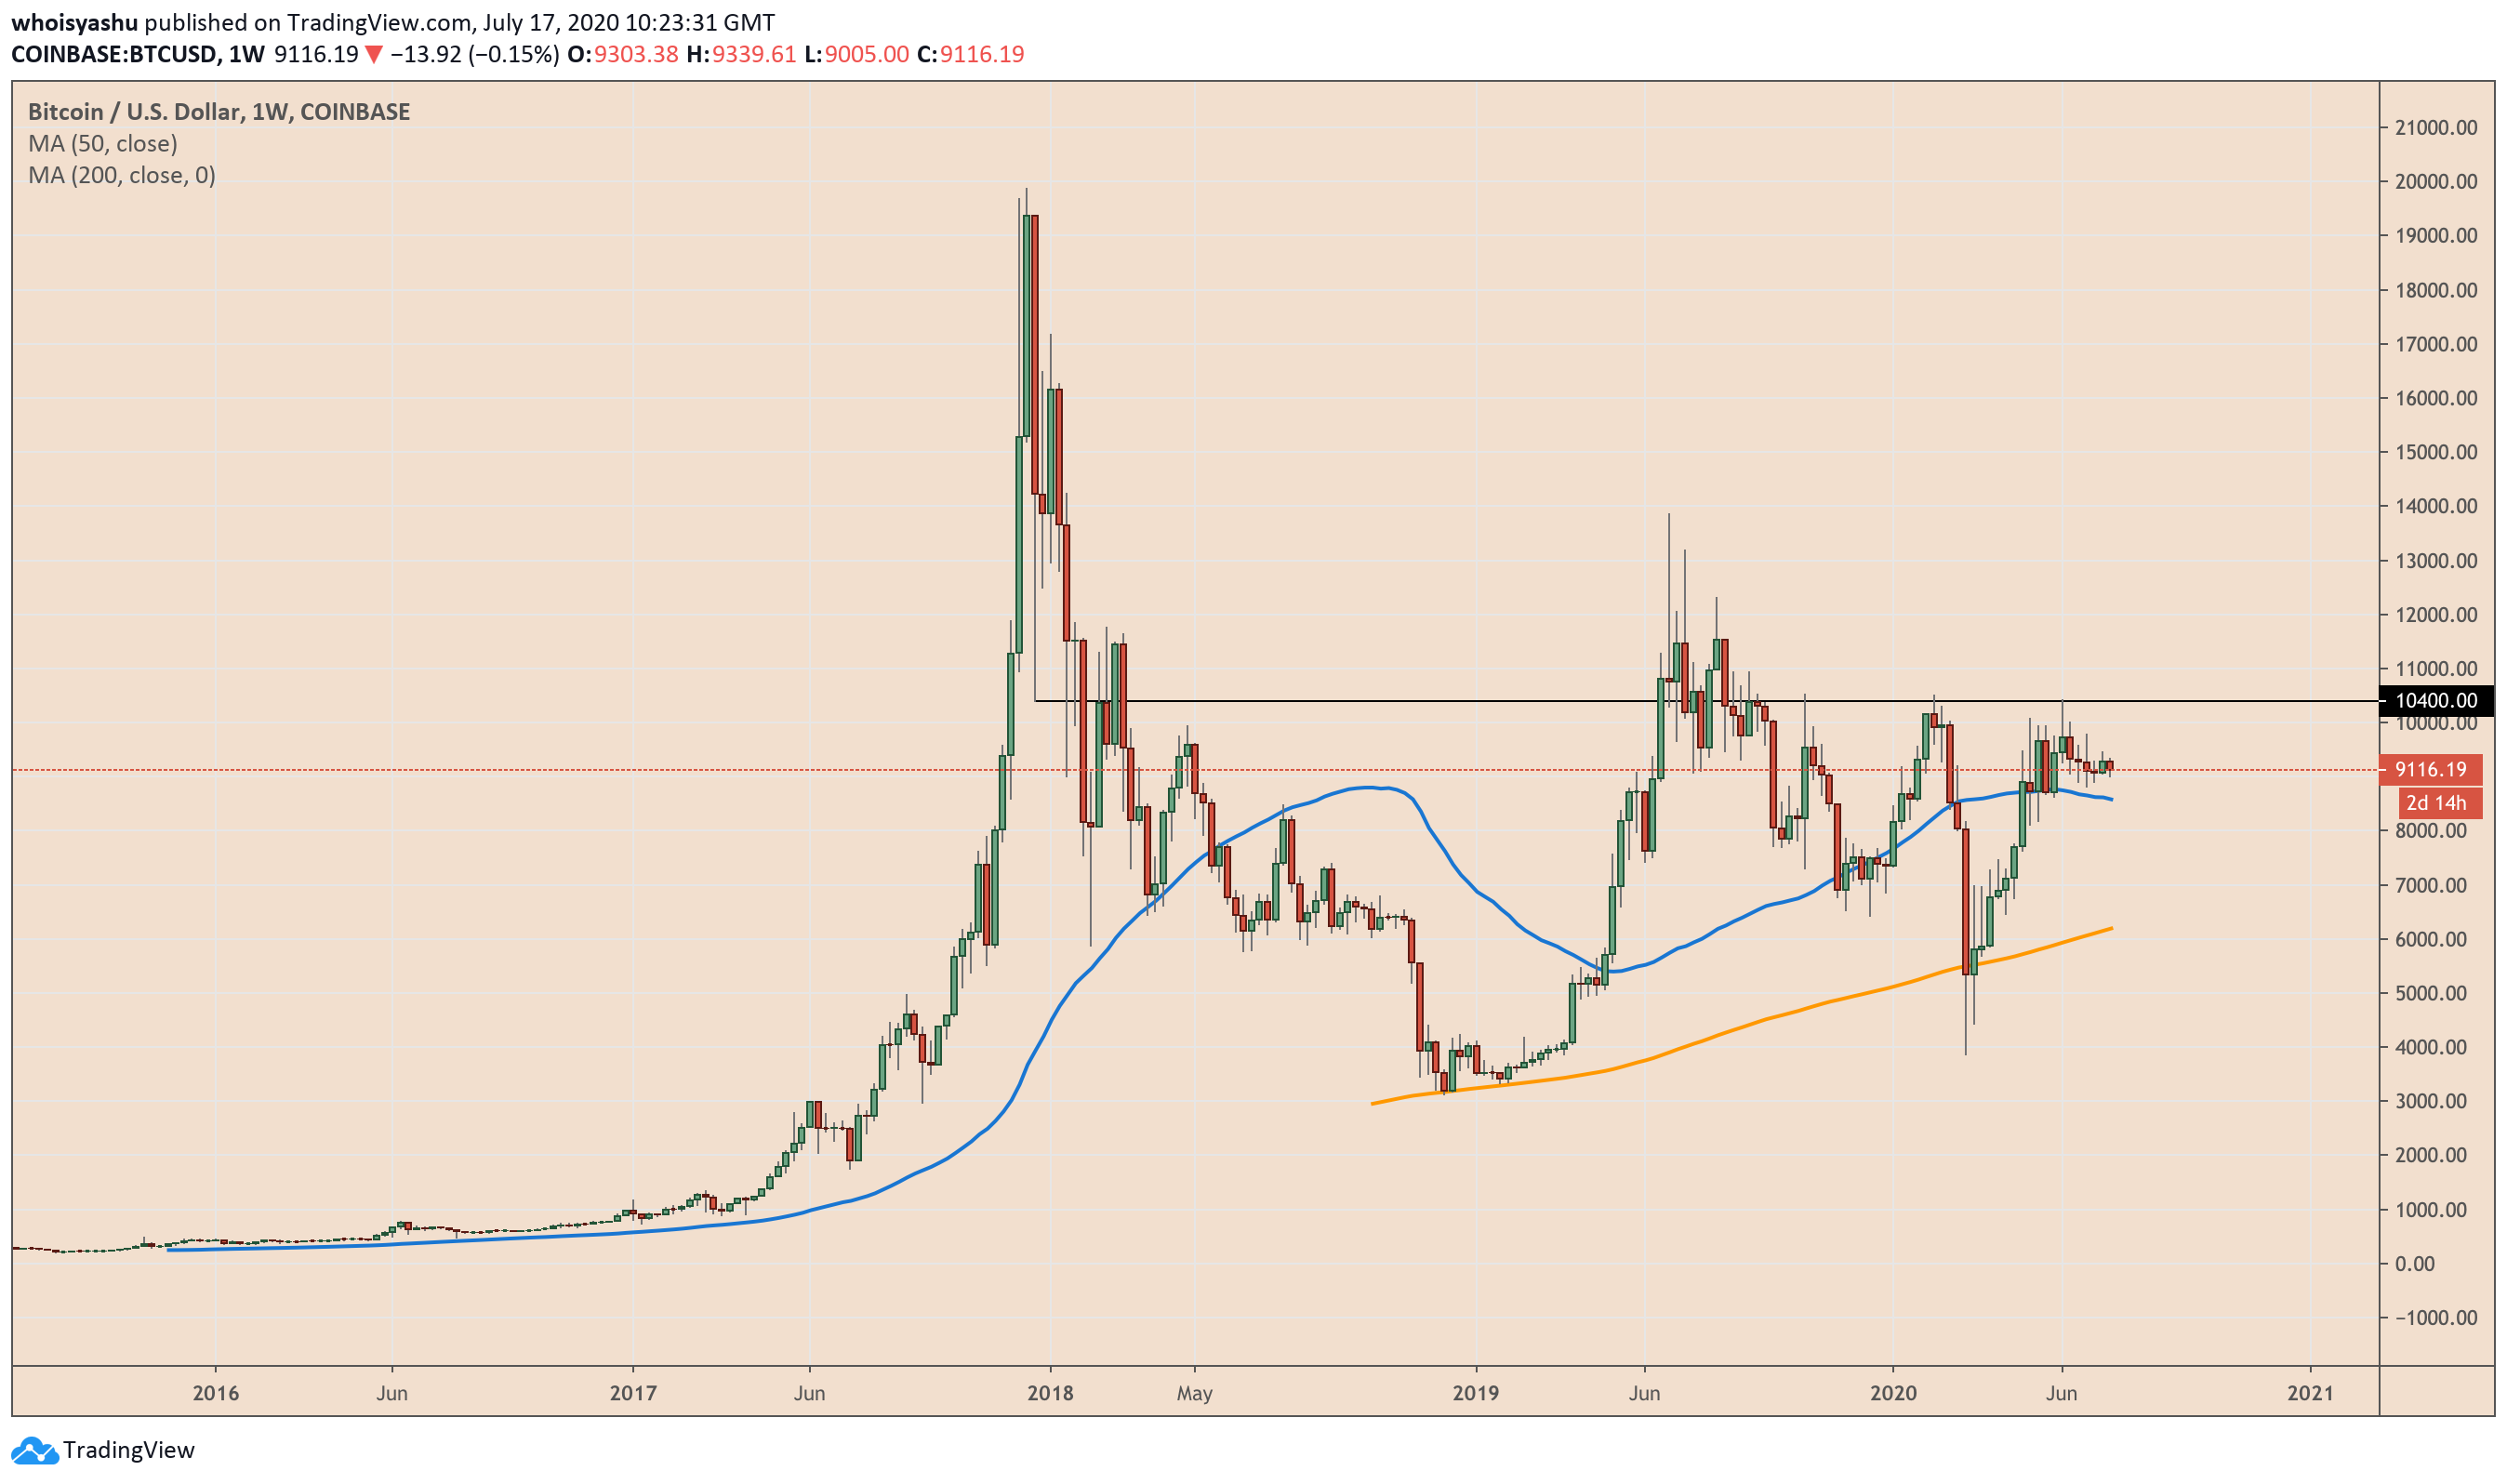
Bitcoin price outlook from the point of view of the blue wave. Source: TradingView.com
BTCUSD always rallied as long as it maintained its hold above the 50-WMA. At the same time, breaking below it prompted traders to switch their bullish bias to bearish. In 2018, for instance, Bitcoin bottomed out near $3,120 six months after breaking below the 50-WMA.
On the other hand, the cryptocurrency’s sharp pullback move in the first half of 2019 saw it leaping over the blue wave. That visibly played an essential role in sending the price towards $14,000 in June 2019.
The same fractal repeated later in 2020, bringing Bitcoin now to retest the same blue wave as support. If the cryptocurrency breaks below $9,000, then it may end up falling towards the 50-WMA.
The wave is near the $8,500-mark.
#2 MACD Bearish Cross
Zooming the Bitcoin price chart back to the daily timeframe shows the beginning of a bearish bias, at least according to a textbook indicator traders use to predict short-term trends.
Dubbed as MACD, the trend-following momentum indicator shows the relationship between two moving averages. If the short-term MA moves below the long one, then MACD returns a negative value – a bearish bias. The opposite of it returns a positive value, suggesting a bullish bias.
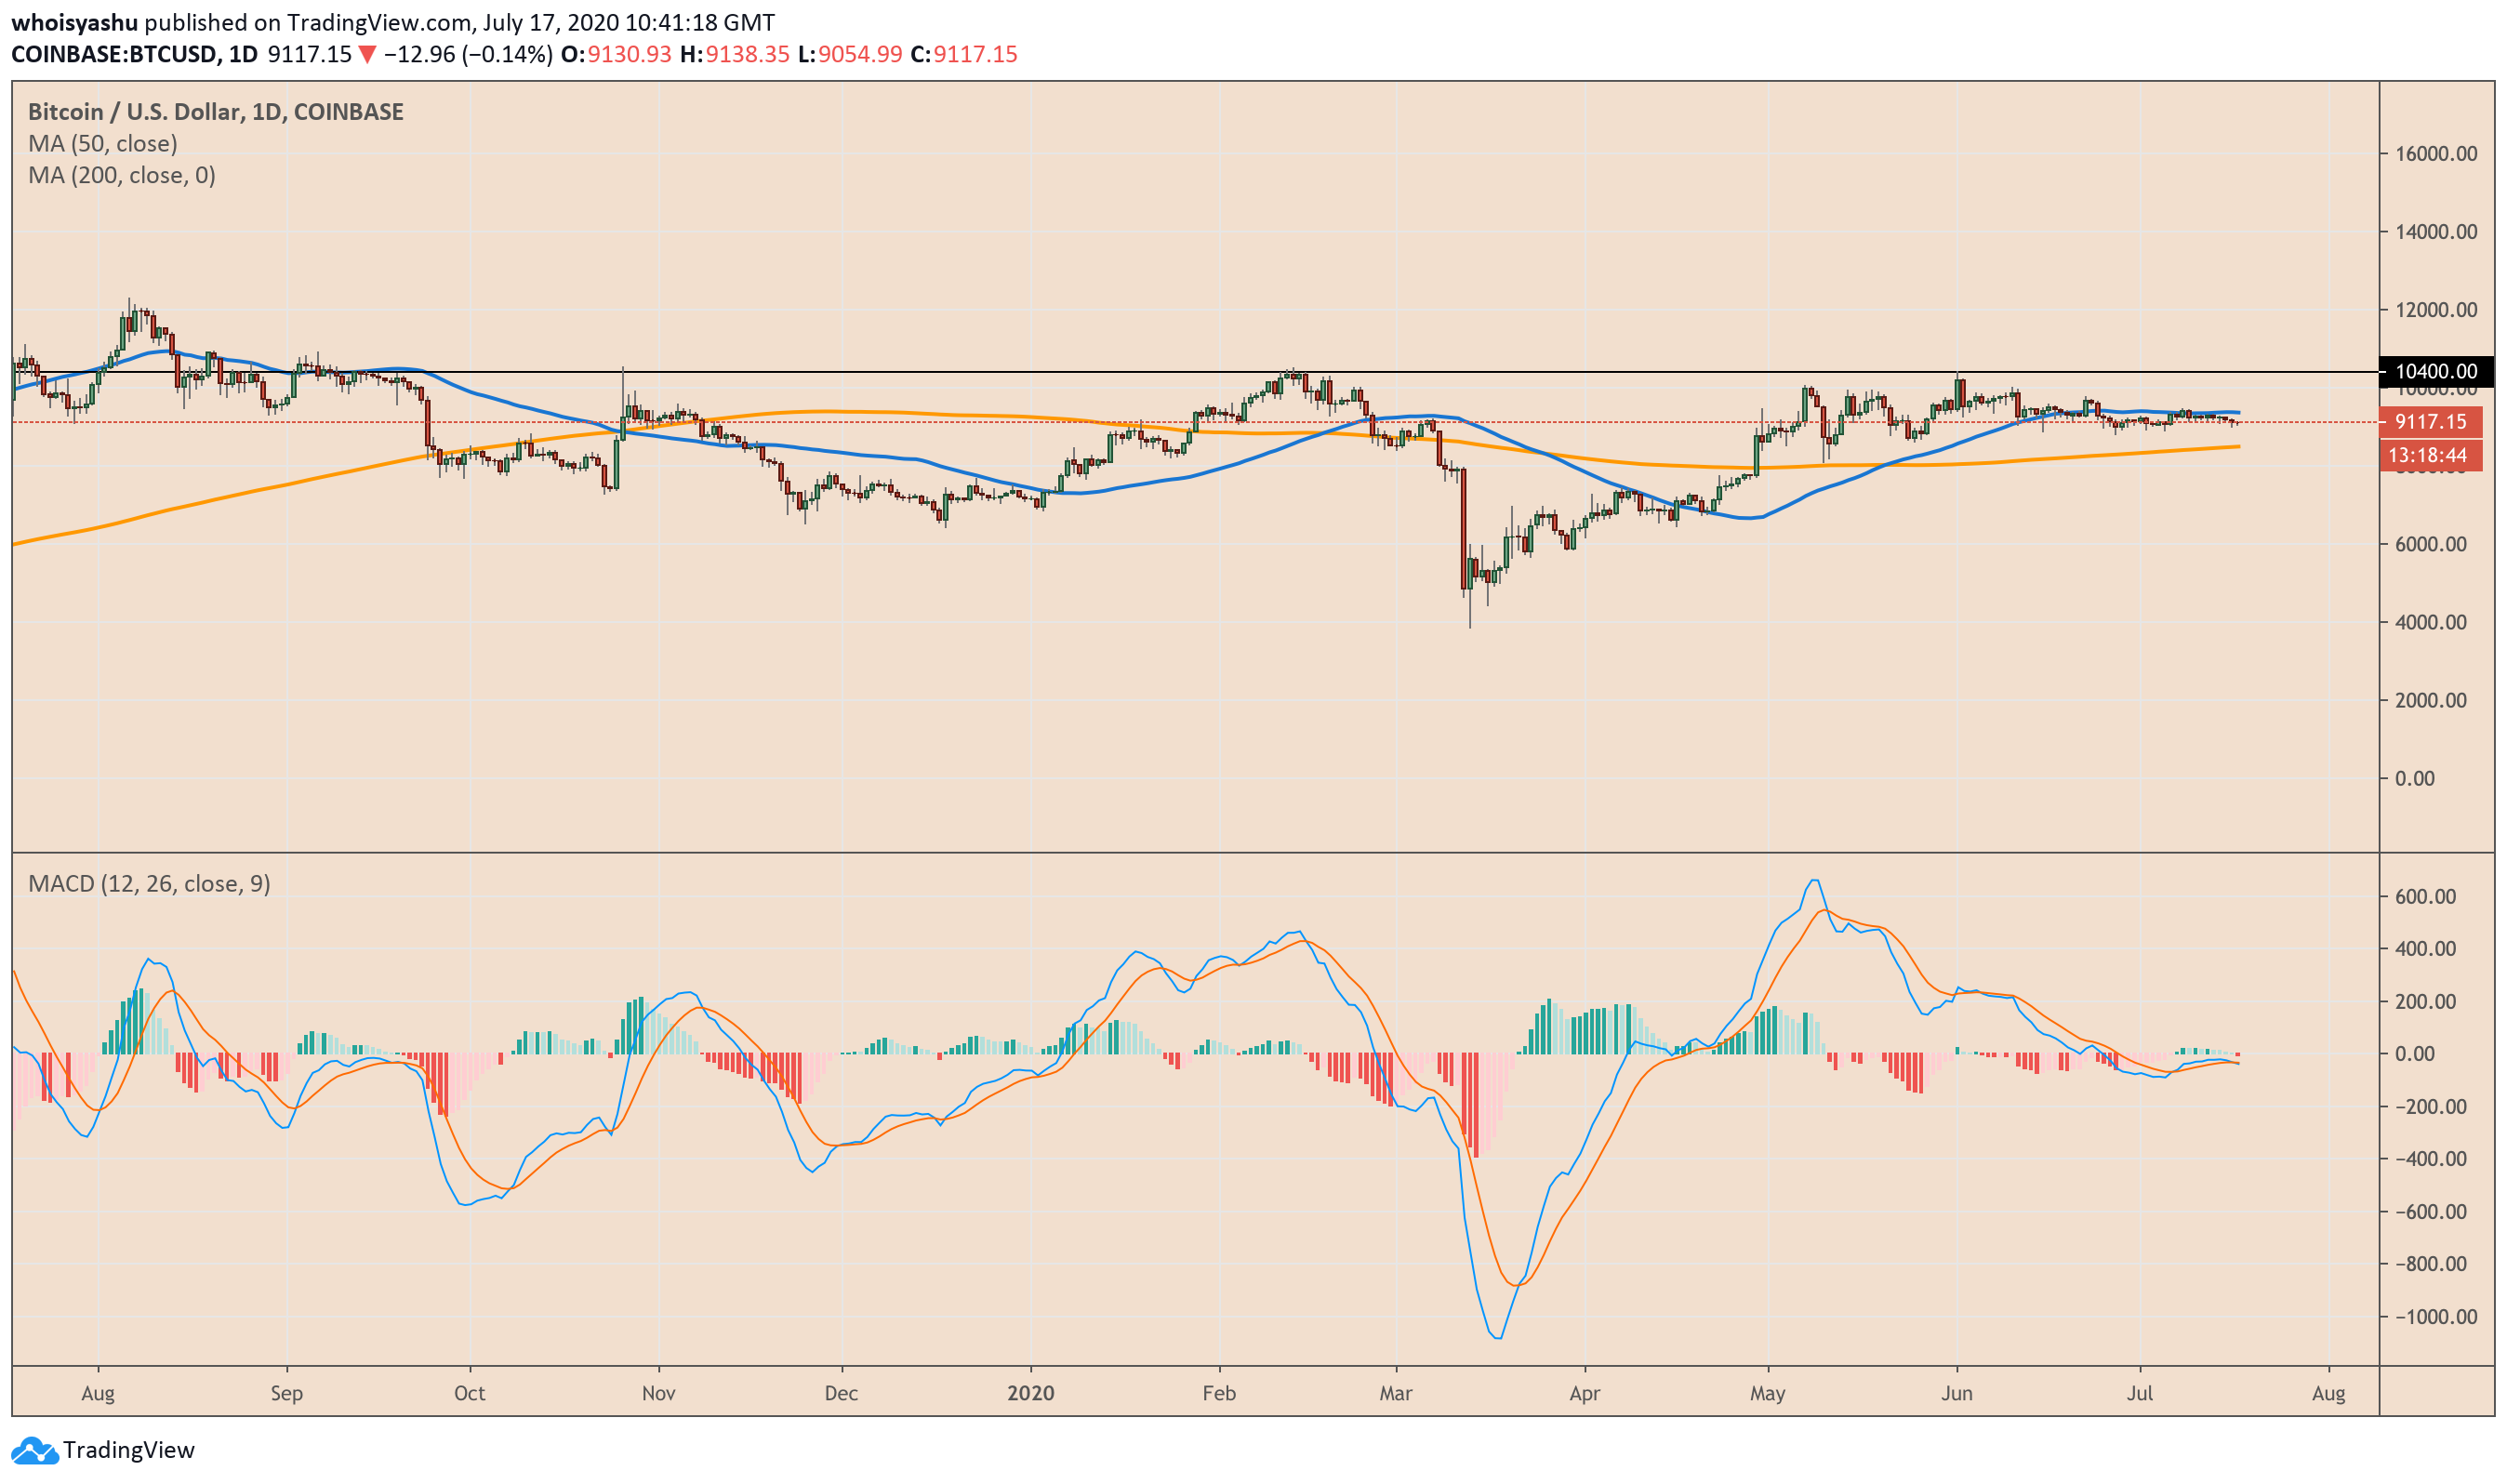
MACD hints a bearish bias. Source: TradingView.com
The outcome of MACD readings shows it crossing below its signal line (a 9-day moving average) while trending below the baseline (defined by zero). That points to an increase in selling pressure in the BTC market.


